


Median Age
34 Years
Largest Age Group
25-34 Years
Approximately 17% of Residents
Under 20
26%
Over 65
14%
Avg Rent
$1,354
Population
120,305
Renter Mix
79% Rent
Hartford has served as Connecticut's capital since 1875, and the weight of that history is still present in nearly every corner of the city. The skyline mixes colonial architecture with mid-century office towers, anchored by the gold-domed State Capitol and the Connecticut Science Center along the riverfront. Insurance has long shaped the local economy, with major carriers maintaining significant operations here, while Trinity College and the University of Hartford add a steady academic presence. The result is a city that feels both purposeful and layered, where policy, education, and commerce operate side by side.
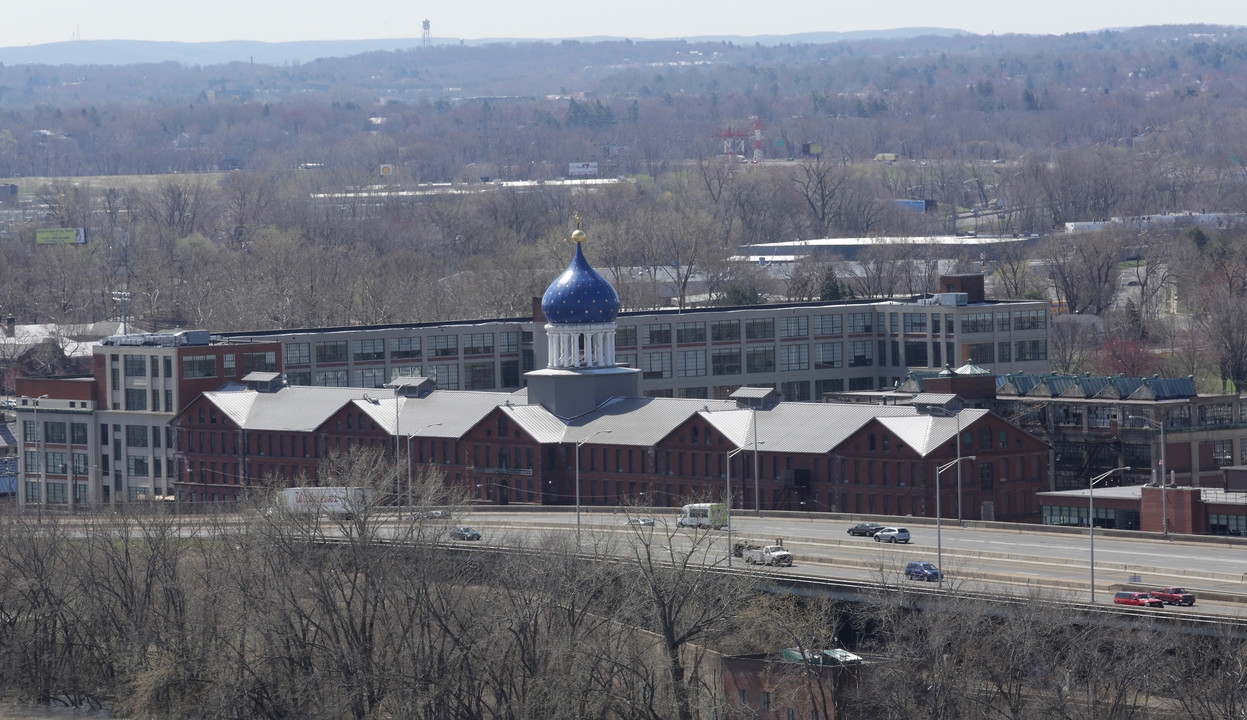
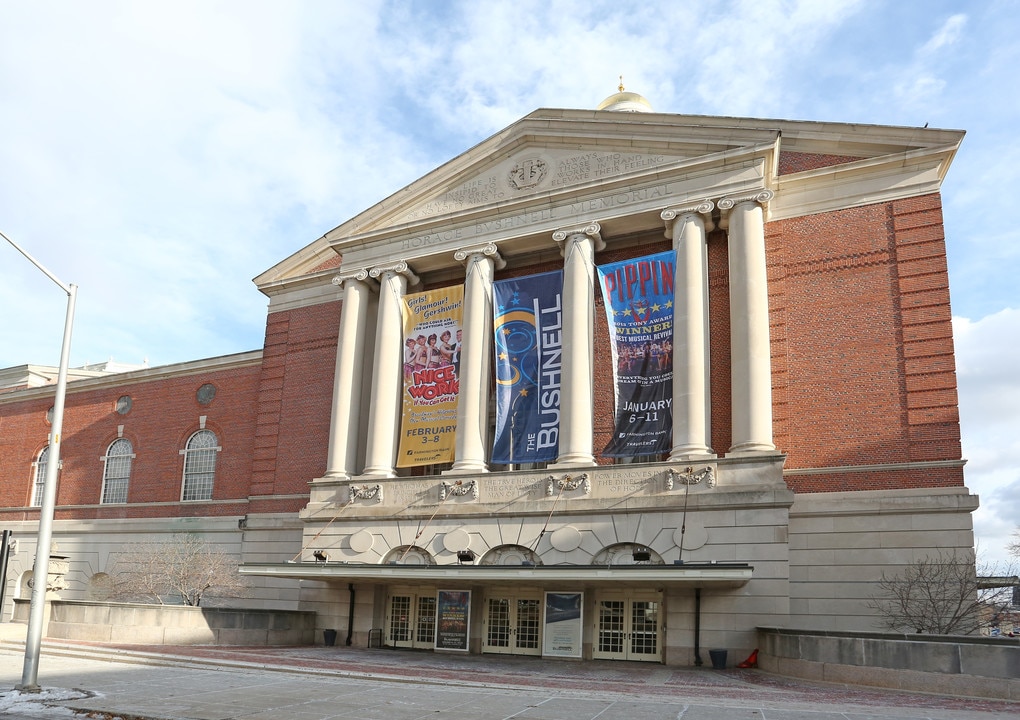
Distinct neighborhoods give Hartford real texture. Asylum Hill sits near the Mark Twain House and several large hospital campuses. Parkville draws attention for its converted mill buildings and active arts community. Downtown and the West End each offer their own rhythm, from walkable streets near Bushnell Park to tree-lined blocks along Farmington Avenue. Rental options reflect that variety, ranging from classic multi-family homes and renovated historic buildings to newer apartment communities with modern amenities. Renters have genuine choices here without the price tags common to nearby suburbs, making Hartford a practical base with plenty of character to back it up.
Beautiful Elizabeth Park
Built in 1872, the Connecticut State Capitol is a National Historic Landmark
The Capitol Building on a snowy day
The Capitol Building's gold dome is a Hartford landmark
The Rose Garden at the center of Elizabeth Park
Hartford's architecture through the trees
Median Household Income
$39,179
Average: $58,911
Education
20,350
Residents Have a Degree
Job Market
53,813
Workers Employed
Median Age
34 Years
Largest Age Group
25-34 Years
Approximately 17% of Residents
Under 20
26%
Over 65
14%
Housing Distribution
Hartford has more renters than homeowners.

Education Distribution
Review this city's overall education levels.

As of July 2026, the average apartment rent in Hartford, CT is $1,251 for a studio, $1,354 for one bedroom, $1,635 for two bedrooms, and $1,563 for three bedrooms. Apartment rent in Hartford has increased by 0.8% in the past year.
The cost of living in Hartford, CT is 1.6% higher than the national average. Generally, housing in Hartford is 12.5% less expensive than the national average, with rent falling between $1,251 - $1,635. You can expect to pay 3.5% more for groceries, 24.4% more for utilities, and 3.3% more for transportation.
Compare Cities
Explore how walkable, bikeable, drivable, and transit-friendly Hartford, CT is for everyday living.
Very Walkable
Walkability
Exceptional Public Transit
Transit
Very Drivable
Drivability
Moderately Bikeable
Bikeability
Public
Grades K-8
128 Students

Dr. Ramon E. Betances Early Reading Lab School
Public
Grades PK-5
398 Students

Stem Magnet School At Annie-Fisher School
Public
Grades K-8
348 Students
Noah Webster Micro Society School
Public
Grades PK-8
626 Students

Public
Grades PK-8
435 Students
Public
Grades K-8
128 Students
Stem Magnet School At Annie-Fisher School
Public
Grades K-8
348 Students
Noah Webster Micro Society School
Public
Grades PK-8
626 Students
Public
Grades 6-12
438 Students
Public
Grades PK-8
435 Students
Public
Grades 9-12
406 Students
Public
Grades 6-12
438 Students
Hartford Magnet Trinity College Academy
Public
Grades 6-12
925 Students

Achievement First Hartford Academy Inc.
Public
Grades K-12
907 Students
A. I. Prince Technical High School
Public
Grades 9-12
725 Students
† Our analysis of utilities, groceries, transportation, healthcare, home prices, and other goods and services is sourced from the Cost of Living Index, a respected benchmark published by the Council for Community and Economic Research (C2ER) that provides a thorough overview of living expenses across different regions.
Rent data is provided by CoStar Group’s Market Trend reports. As the industry leader in commercial real estate information, analytics, and news, CoStar conducts extensive research to produce and maintain a comprehensive database of commercial real estate information. We combine this data with public record to provide the most up-to-date rental information available.
Consumer goods, services, and home prices are sourced from the Cost of Living Index published by the Council for Community and Economic Research (C2ER). The data on this page is updated quarterly. It was last published in June 2026.
Demographic information comes from Neustar and combines detailed address data with U.S. Census and American Community Survey statistics to produce reliable local estimates.


