
Seneca Village
750 Clopper Rd,
Gaithersburg, MD 20878
$1,670 - $2,698
1-3 Beds


Welcome to Gaithersburg, a welcoming city in Montgomery County that combines suburban comfort with metropolitan convenience. Located in Montgomery County, this community offers diverse housing options, from historic homes in Olde Towne to contemporary residences in the Kentlands and Lakelands neighborhoods. The city's thoughtful development has created walkable neighborhoods with tree-lined streets, community parks, and shopping destinations. The RIO Washingtonian Center offers waterfront dining and entertainment options along its scenic lakefront setting.
Gaithersburg's outdoor spaces include Bohrer Park, home to a water park and recreation center. The National Institute of Standards and Technology (NIST) campus has established the city as a center for scientific research and technology innovation. Local history comes alive at the Gaithersburg Latitude Observatory, the city's National Historic Landmark, which served as an important astronomical research facility until 1982. The community celebrates its cultural heritage through year-round festivals and events, while offering convenient access to Washington D.C. via the Shady Grove Metro station. With its mix of historic architecture and contemporary amenities, Gaithersburg provides a comfortable suburban setting just minutes from the capital.
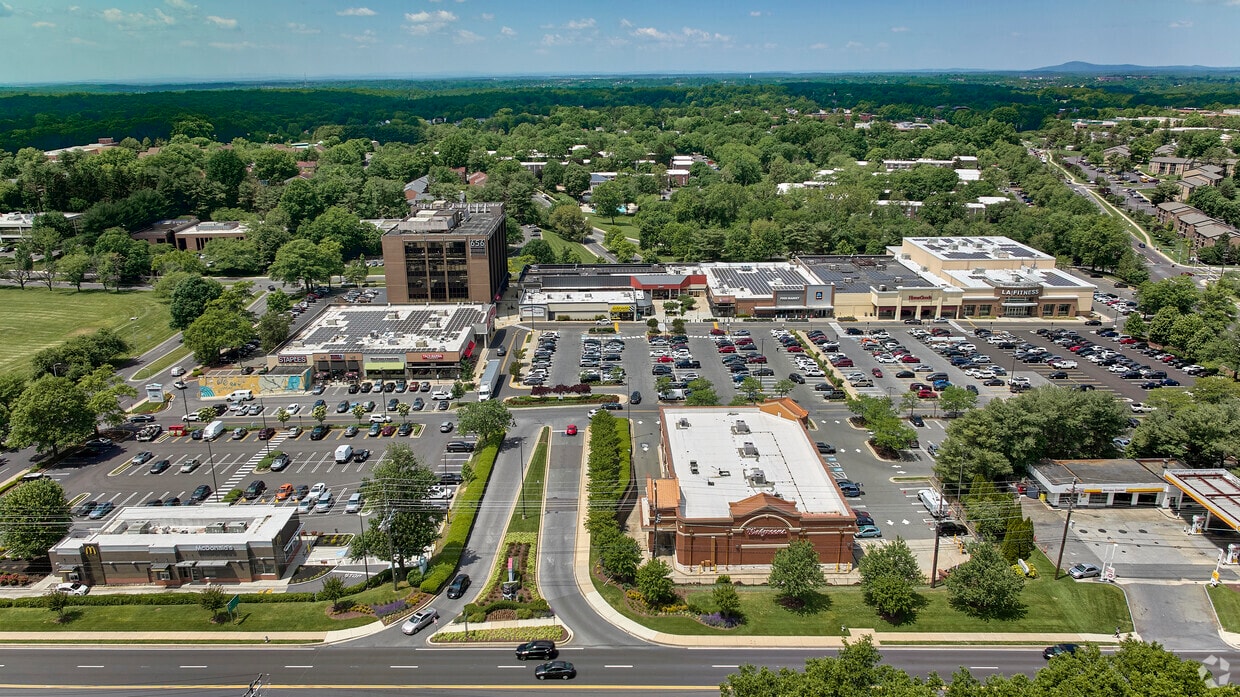
Rio Washingtonian Center is a popular spot for shopping, dining and entertainment in Gaithersburg, Maryland.
The Gaithersburg neighborhood is home to many parks and green spaces.
Family-friendly homes in Metropolitan Grove's quiet neighborhoods.
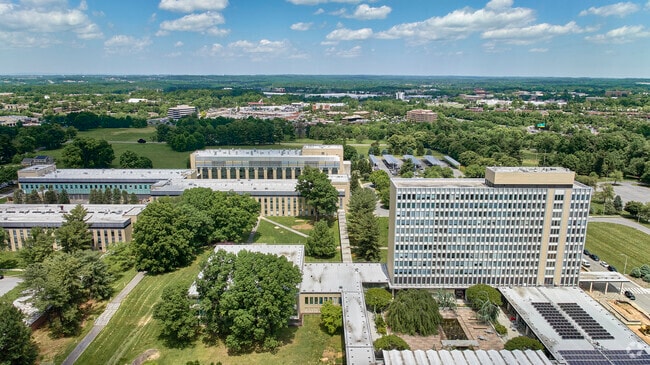
The National Institute of Standards and Technology is located in Metropolitan Grove, Maryland.
Experience Shady Grove's exciting night life in Rio.
Gaithersburg is a large urban suburb of Washington D.C.
As of March 2026, the average apartment rent in Gaithersburg, MD is $1,673 for a studio, $1,737 for one bedroom, $2,081 for two bedrooms, and $2,473 for three bedrooms. Apartment rent in Gaithersburg has decreased by -1.9% in the past year.
The cost of living in Gaithersburg, MD is 34.4% higher than the national average. Generally, housing in Gaithersburg is 95.4% more expensive than the national average, with rent falling between $1,673 - $2,473. You can expect to pay 8.8% more for groceries, 9.9% more for utilities, and 0.4% more for transportation.
Explore how walkable, bikeable, drivable, and transit-friendly Gaithersburg, MD is for everyday living.
Somewhat Walkable
You might be able to get out and walk when living in this area. Some errands can be accomplished on foot, but for others you’ll need a car.
Some Transit
You'll likely want a car when living in this area since it has few transit options.
Bikeable
While there’s some bike infrastructure in this area, you’ll still need a car for many errands.
Public
Grades K-5

Public
Grades PK-5

Public
Grades K-5
Public
Grades PK-5
Public
Grades PK-5

Public
Grades 6-8
Public
Grades 6-8
Public
Grades 6-8

Public
Grades 6-8

Public
Grades 6-8

Public
Grades 9-12
Public
Grades 9-12
Public
Grades 9-12

390
Communities
119,598
Units
158
Cities
209
Communities
60,487
Units
116
Cities

51
Communities
11,836
Units
33
Cities

28
Communities
6,220
Units
15
Cities

3,490
Communities
959,772
Units
895
Cities

159
Communities
26,767
Units
111
Cities
† Our analysis of utilities, groceries, transportation, healthcare, home prices, and other goods and services is sourced from the Cost of Living Index, a respected benchmark published by the Council for Community and Economic Research (C2ER) that provides a thorough overview of living expenses across different regions.
Rent data is provided by CoStar Group’s Market Trend reports. As the industry leader in commercial real estate information, analytics, and news, CoStar conducts extensive research to produce and maintain a comprehensive database of commercial real estate information. We combine this data with public record to provide the most up-to-date rental information available.
Consumer goods, services, and home prices are sourced from the Cost of Living Index published by the Council for Community and Economic Research (C2ER). The data on this page is updated quarterly. It was last published in February 2026.


