
Park Place Towers
24 Park Pl,
Hartford, CT 06106
$1,380 - $1,885 Total Monthly Price
1-2 Beds


Frog Hollow is a predominantly residential community minutes from Downtown Hartford and Trinity College. The entire neighborhood is listed on the National Register of Historic Places and covers more than 150 acres. Between 1850 and 1930, Frog Hollow experienced a rapid increase in development – many of these buildings and homes still stand today.
The name of the community was taken from the marsh lands near the intersection of Broad and Ward Streets. Residents adore its international fare restaurants along Park Street. Firebox is a gourmet restaurant in town with an impressive menu, and it’s in walking distance of Columbus Green Park.
Many businesses like the Connecticut Department of Public Health call Frog Hollow home.
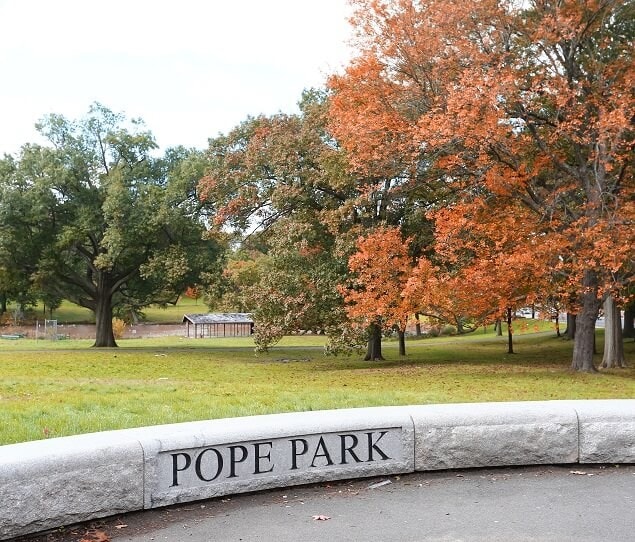
Fountain in Pope Park
The Olmsted brothers completed the design for Pope Park in 1898
The top-rated Firebox Restaurant is known for its farm-to-table cuisine
The Red Rock Tavern is a local favorite
As of March 2026, the average apartment rent in Frog Hollow is $1,101 for a studio, $1,271 for one bedroom, $1,555 for two bedrooms, and $1,152 for three bedrooms. Apartment rent in Frog Hollow has decreased by -0.4% in the past year.
Studio
509 sq ft
Average Sq Ft
$1,101/month
Average Rent
1 BR
685 sq ft
Average Sq Ft
$1,271/month
Average Rent
2 BR
955 sq ft
Average Sq Ft
$1,555/month
Average Rent
3 BR
687 sq ft
Average Sq Ft
$1,152/month
Average Rent
Explore how walkable, bikeable, drivable, and transit-friendly Frog Hollow - Hartford, CT is for everyday living.
Very Walkable
If you enjoy walking, you’ll enjoy renting in this area! It’s a very walkable neighborhood.
Good Transit
The area around this property has good transit with many nearby transportation options.
Bikeable
While there’s some bike infrastructure in this area, you’ll still need a car for many errands.
Niche User
9 years and 11 months ago•Niche Review
I am hopeful that it would get better, but it's not ideal just okay
Niche User
9 years and 11 months ago•Niche Review
its a good place to live

3,487
Communities
959,069
Units
894
Cities

715
Communities
198,674
Units
340
Cities

624
Communities
174,107
Units
248
Cities

624
Communities
125,068
Units
245
Cities

554
Communities
124,135
Units
220
Cities

457
Communities
108,184
Units
229
Cities
† Our analysis of utilities, groceries, transportation, healthcare, home prices, and other goods and services is sourced from the Cost of Living Index, a respected benchmark published by the Council for Community and Economic Research (C2ER) that provides a thorough overview of living expenses across different regions.
Rent data is provided by CoStar Group’s Market Trend reports. As the industry leader in commercial real estate information, analytics, and news, CoStar conducts extensive research to produce and maintain a comprehensive database of commercial real estate information. We combine this data with public record to provide the most up-to-date rental information available.
Consumer goods, services, and home prices are sourced from the Cost of Living Index published by the Council for Community and Economic Research (C2ER). The data on this page is updated quarterly. It was last published in February 2026.


