Beacon
3510 Beacon Ave,
Fremont, CA 94538
$2,695 - $3,780
Studio - 2 Beds
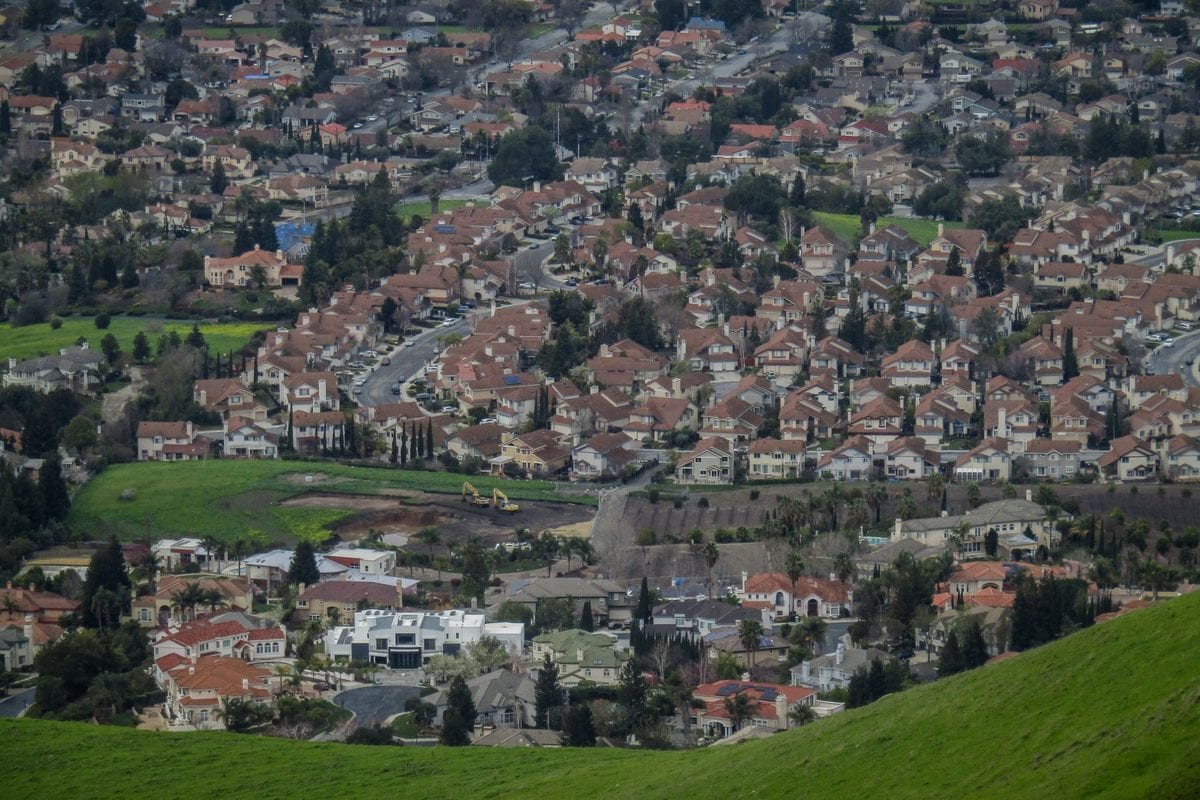
Fremont, positioned in the San Francisco Bay Area, combines suburban living with innovation and technology. As home to the Tesla Factory, the city maintains a strong industrial presence while offering numerous parks and outdoor spaces. Lake Elizabeth in Central Park provides recreational opportunities, while Mission Peak's trails showcase panoramic Bay Area views. The rental market remains competitive, with average rents ranging from $2,204 for studios to $3,770 for three-bedroom homes, with year-over-year increases between 1.5% and 4.4%.
The city's five districts each offer distinct characteristics. Historic Niles preserves its early film industry heritage, while Mission San Jose features the restored Mission San José, an architectural landmark from 1797. The Warm Springs area has developed into a technology center, and Central Fremont includes shopping destinations like the Fremont Hub and Pacific Commons. Outdoor enthusiasts can explore Coyote Hills Regional Park and Don Edwards National Wildlife Refuge. Located between Silicon Valley and the East Bay, Fremont combines convenient access to major employment centers with well-maintained neighborhoods and parks.
As of February 2026, the average apartment rent in Fremont, CA is $2,195 for a studio, $2,509 for one bedroom, $3,101 for two bedrooms, and $3,809 for three bedrooms. Apartment rent in Fremont has increased by 0.6% in the past year.
Somewhat Walkable
out of 100 WalkScore® Rating
You might be able to get out and walk when living in this area. Some errands can be accomplished on foot, but for others you’ll need a car.
Some Transit
out of 100 TransitScore® Rating
You'll likely want a car when living in this area since it has few transit options.
Bikeable
out of 100 BikeScore® Rating
While there’s some bike infrastructure in this area, you’ll still need a car for many errands.
Public
Grades 3-5
574 Students

Public
Grades K-5
362 Students
Public
Grades 1-5
719 Students

Public
Grades 1-5
637 Students
Public
Grades 1-5
457 Students
Public
Grades 6-8
1,972 Students
Public
Grades 6-8
1,574 Students
Public
Grades 6-8
1,424 Students
Public
Grades 6-8
1,495 Students

Public
Grades 6-8
1,149 Students

Public
Grades 9-12
2,618 Students
Public
Grades 9-12
2,157 Students
Public
Grades 9-12
1,794 Students
Public
Grades 9-12
1,957 Students
Public
Grades 9-12
1,273 Students

104
Communities
36,751
Units
56
Cities
65
Communities
10,535
Units
31
Cities

636
Communities
126,351
Units
249
Cities
163
Communities
53,297
Units
74
Cities

11
Communities
1,517
Units
7
Cities

3,466
Communities
953,670
Units
893
Cities
† Our analysis of utilities, groceries, transportation, healthcare, home prices, and other goods and services is sourced from the Cost of Living Index, a respected benchmark published by the Council for Community and Economic Research (C2ER) that provides a thorough overview of living expenses across different regions.
Rent data is provided by CoStar Group’s Market Trend reports. As the industry leader in commercial real estate information, analytics, and news, CoStar conducts extensive research to produce and maintain a comprehensive database of commercial real estate information. We combine this data with public record to provide the most up-to-date rental information available.
Consumer goods, services, and home prices are sourced from the Cost of Living Index published by the Council for Community and Economic Research (C2ER). The data on this page is updated quarterly. It was last published in February 2026.


