Median Age
35 Years
Largest Age Group
30-39 Years
Approximately 16% of Residents
Under 20
27%
Over 65
11%

Avg Rent
$2,304
Population
26,752
Renter Mix
64% Rent
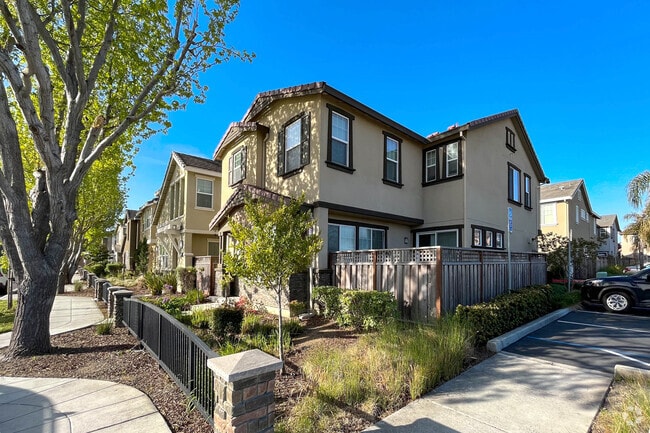
East Palo Alto sits at the edge of San Francisco Bay in San Mateo County, positioned almost exactly halfway between San Francisco and San Jose on the Peninsula. That central location puts residents within reach of two major job markets, and the city itself has drawn tech industry investment that continues to reshape its small but dense three-square-mile footprint. Incorporated in 1983, it carries a distinct identity separate from neighboring Palo Alto, though the two cities are divided by little more than San Francisquito Creek. Stanford University sits about five miles to the southwest, reinforcing the area's academic and innovation-driven atmosphere.
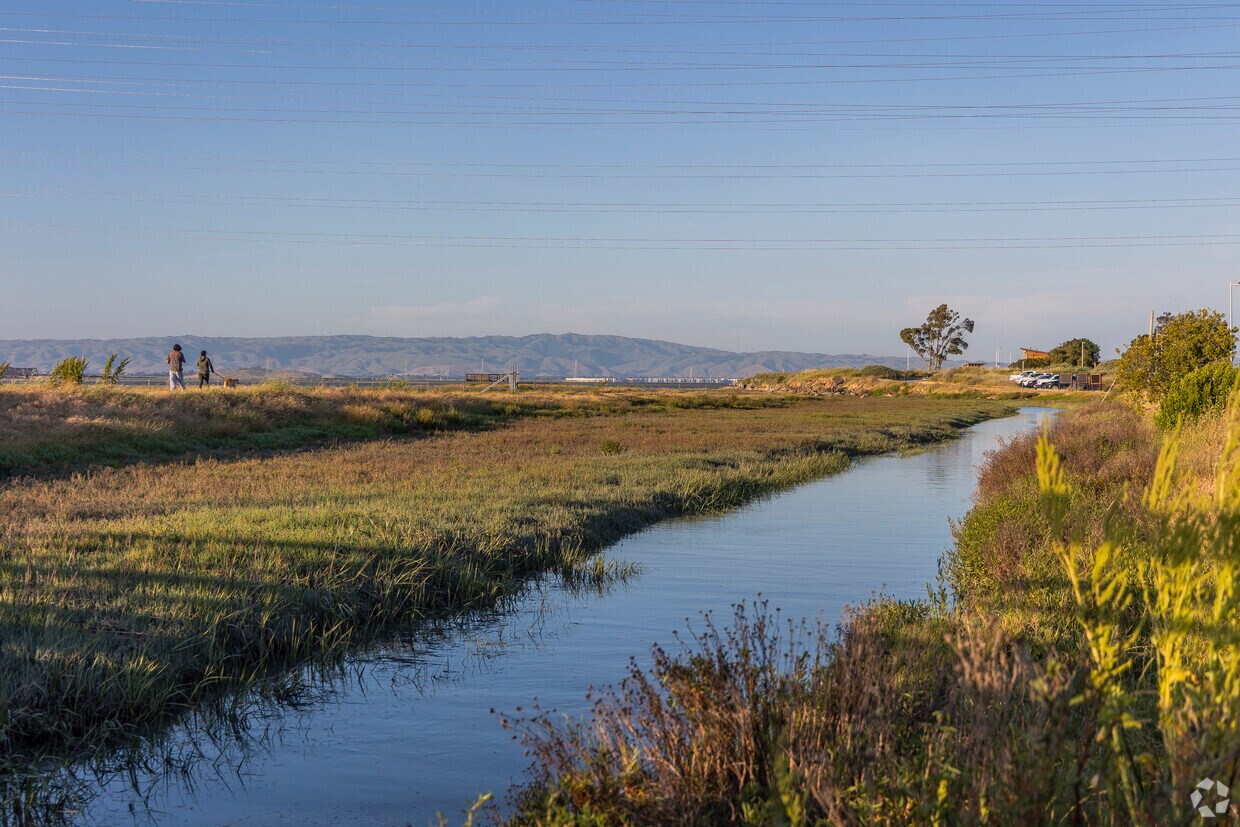
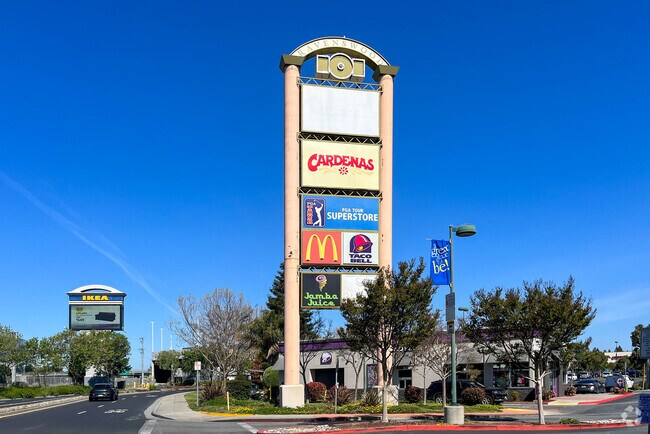
The housing mix here runs toward apartment communities and rental homes rather than high-rises, offering options that tend to be more accessible than those in surrounding Peninsula cities. Ravenswood 101 serves as the main commercial corridor, anchoring everyday retail alongside the bay shoreline. The Ravenswood Open Space Preserve offers a direct connection to the natural landscape, with bay views stretching toward Alameda County across the Dumbarton Bridge. For renters who want proximity to Silicon Valley's core without paying Palo Alto or Menlo Park prices, East Palo Alto presents a grounded, well-connected alternative with room still to grow.
Cooley Landing Park is a 9-acre peninsula at the end of Bay Road in East Palo Alto.
Groups of Craftsman-style homes dot the East Palo Alto neighborhood.
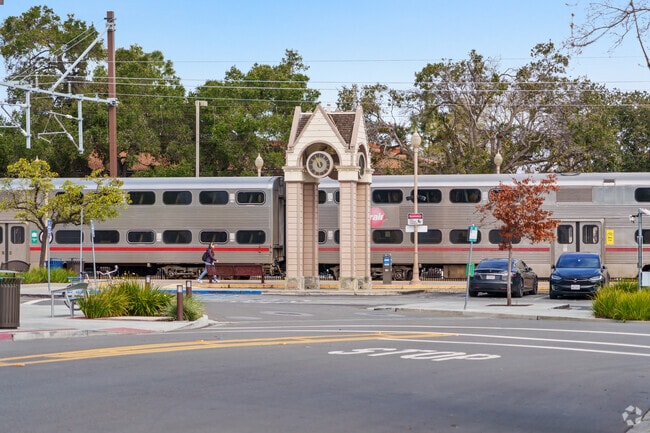
Caltrain departs from a bustling station near East Palo Alto.
Vibrant outdoor market bustles with shoppers near East Palo Alto.
East Palo Alto's Bay Trail follows the edge of the neighborhood.
East Palo Alto is served by SamTrans bus lines.
Median Household Income
$92,891
Average: $125,735
Education
6,566
Residents Have a Degree
Job Market
14,363
Workers Employed
Median Age
35 Years
Largest Age Group
30-39 Years
Approximately 16% of Residents
Under 20
27%
Over 65
11%
Housing Distribution
East Palo Alto has more renters than homeowners.

Education Distribution
Review this city's overall education levels.

As of August 2026, the average apartment rent in East Palo Alto, CA is $2,071 for a studio, $2,304 for one bedroom, $2,892 for two bedrooms, and $3,959 for three bedrooms. Apartment rent in East Palo Alto has increased by 2.8% in the past year.
Explore how walkable, bikeable, drivable, and transit-friendly East Palo Alto, CA is for everyday living.
Fairly Walkable
Walkability
Limited Public Transit
Transit
Exceptionally Drivable
Drivability
Moderately Bikeable
Bikeability

Los Robles-Ronald McNair Academy
Public
Grades K-5
276 Students

Public
Grades K-5
369 Students

Public
Grades K-5
369 Students
Public
Grades K-8
496 Students

Public
Grades K-5
386 Students
Ravenswood Comprehensive Middle
Public
Grades 6-8
488 Students
Public
Grades K-8
496 Students
Public
Grades 8
121 Students

Public
Grades 6-8
114 Students
Public
Grades 9-12
194 Students

Public
Grades 9-12
278 Students
Public
Grades 9-12
108 Students
 The GreatSchools Rating helps parents compare schools within a state based on a variety of school quality indicators and provides a helpful picture of how effectively each school serves all of its students. Ratings are on a scale of 1 (below average) to 10 (above average) and can include test scores, college readiness, academic progress, advanced courses, equity, discipline and attendance data. We also advise parents to visit schools, consider other information on school performance and programs, and consider family needs as part of the school selection process.
View GreatSchools Rating Methodology
Data provided by
GreatSchools.org
© 2026. All rights reserved.
The GreatSchools Rating helps parents compare schools within a state based on a variety of school quality indicators and provides a helpful picture of how effectively each school serves all of its students. Ratings are on a scale of 1 (below average) to 10 (above average) and can include test scores, college readiness, academic progress, advanced courses, equity, discipline and attendance data. We also advise parents to visit schools, consider other information on school performance and programs, and consider family needs as part of the school selection process.
View GreatSchools Rating Methodology
Data provided by
GreatSchools.org
© 2026. All rights reserved.
† Our analysis of utilities, groceries, transportation, healthcare, home prices, and other goods and services is sourced from the Cost of Living Index, a respected benchmark published by the Council for Community and Economic Research (C2ER) that provides a thorough overview of living expenses across different regions.
Rent data is provided by CoStar Group’s Market Trend reports. As the industry leader in commercial real estate information, analytics, and news, CoStar conducts extensive research to produce and maintain a comprehensive database of commercial real estate information. We combine this data with public record to provide the most up-to-date rental information available.
Consumer goods, services, and home prices are sourced from the Cost of Living Index published by the Council for Community and Economic Research (C2ER). The data on this page is updated quarterly. It was last published in June 2026.
Demographic information comes from Neustar and combines detailed address data with U.S. Census and American Community Survey statistics to produce reliable local estimates.