Median Age
41 Years
Largest Age Group
40-49 Years
Approximately 14% of Residents
Under 20
24%
Over 65
17%

Avg Rent
$1,758
Population
95,795
Renter Mix
35% Rent
Franklin, Tennessee combines historic preservation with contemporary living, offering an appealing suburban setting just 21 miles south of Nashville. This city of over 83,000 residents features a picturesque downtown district and diverse rental options throughout its neighborhoods. Current average rents range from $1,746 for one-bedroom units to $3,071 for three-bedroom homes. While rental prices have remained relatively stable year-over-year, Franklin continues to draw residents with its tree-lined streets and established neighborhoods.
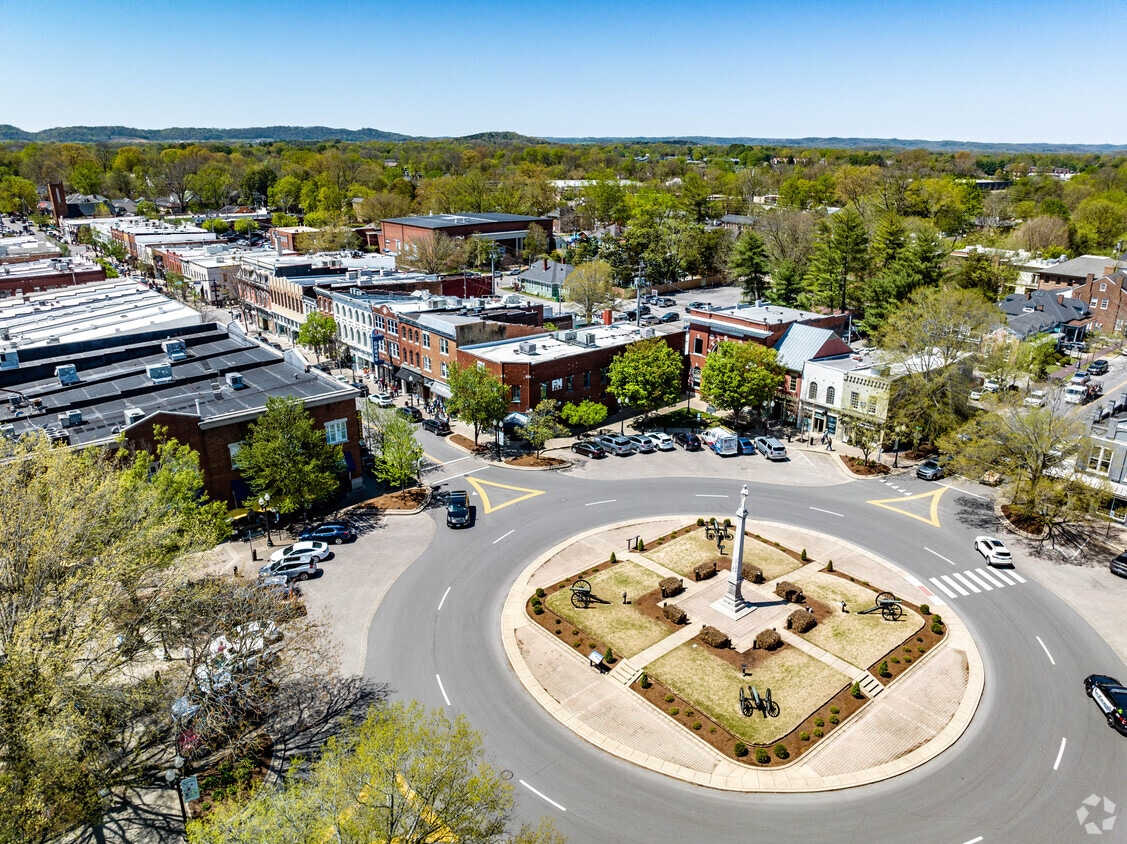
The heart of Franklin revolves around its historic downtown square, where locally-owned shops and eateries line the streets alongside the restored Franklin Theatre. Outdoor enthusiasts appreciate The Park at Harlinsdale Farm, a 200-acre former Tennessee Walking Horse farm, and Eastern Flank Battlefield Park, which preserves an important Civil War site. Notable areas include Cool Springs, with its extensive retail district; Westhaven, recognized for its architectural details; and Downtown Franklin, where historic properties blend with newer developments. Major employers in the area include Nissan North America's headquarters and Community Health Systems. The community calendar stays full with signature events like the Pilgrimage Music & Cultural Festival and the winter tradition of Dickens of a Christmas.
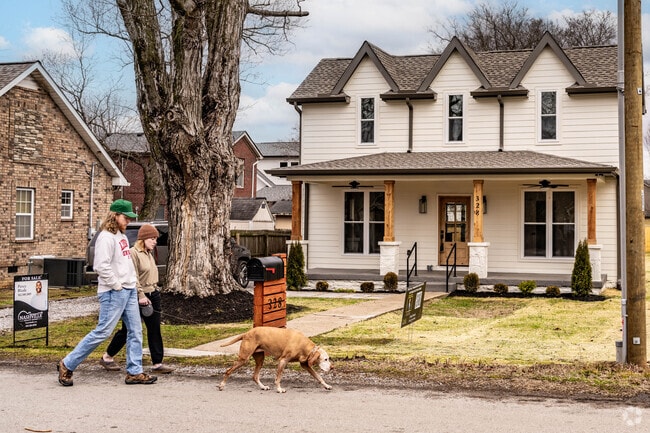
You can walk your dog on the quiet streets of downtown Franklin.
Greenways offer plenty of space for outdoor recreation.
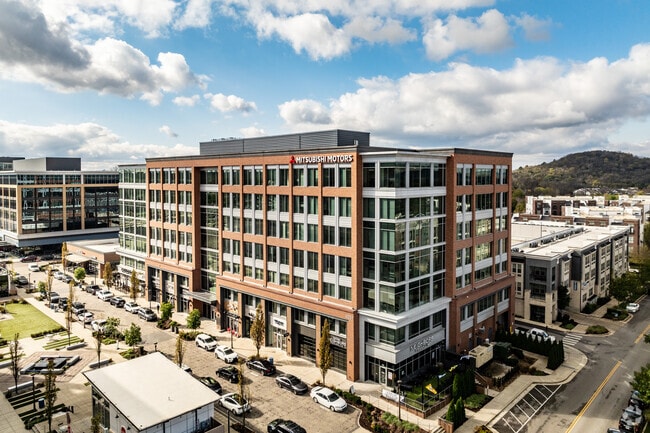
Major businesses have offices right next to apartment communities in Franklin.
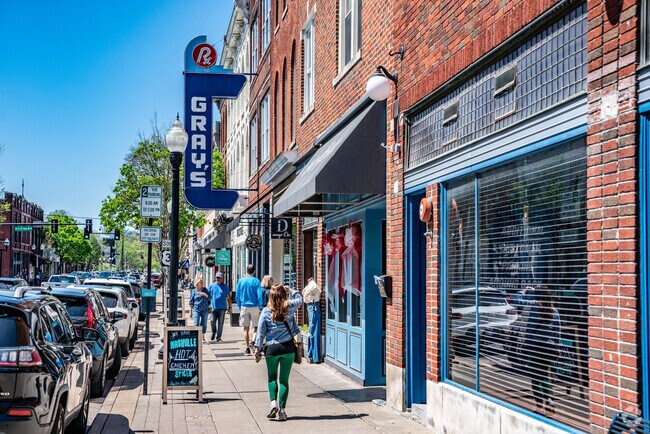
There is plenty of shopping in the Historic Downtown Franklin Neighborhood
Franklin has its own bus system to get you around Franklin.
Heavily wooded lots are common in Franklin.
Median Household Income
$106,232
Average: $141,585
Education
47,233
Residents Have a Degree
Job Market
52,951
Workers Employed
Median Age
41 Years
Largest Age Group
40-49 Years
Approximately 14% of Residents
Under 20
24%
Over 65
17%
Housing Distribution
Franklin has more homeowners than renters.

Education Distribution
Review this city's overall education levels.

As of July 2026, the average apartment rent in Franklin, TN is $1,725 for a studio, $1,758 for one bedroom, $2,187 for two bedrooms, and $3,129 for three bedrooms. Apartment rent in Franklin has increased by 0.2% in the past year.
The cost of living in Franklin, TN is 1.4% lower than the national average. Generally, housing in Franklin is 1.9% more expensive than the national average, with rent falling between $1,725 - $3,129. You can expect to pay 0.2% more for groceries, 1.7% less for utilities, and 10.1% less for transportation.
Compare Cities
Explore how walkable, bikeable, drivable, and transit-friendly Franklin, TN is for everyday living.
Somewhat Walkable
Walkability
Exceptionally Drivable
Drivability
Somewhat Bikeable
Bikeability
Public
Grades PK-5
742 Students

Public
Grades PK-5
742 Students
Public
Grades K-5
703 Students
Public
Grades PK-5
533 Students
Public
Grades PK-5
495 Students
Public
Grades 6-8
862 Students

Public
Grades 6-8
1,249 Students

Public
Grades 6-8
527 Students
Public
Grades 6-8
511 Students
Hillsboro Elementary/ Middle School
Public
Grades K-8
482 Students
Public
Grades 9-12
1,801 Students

Public
Grades 9-12
1,474 Students
Public
Grades 9-12
1,284 Students
Public
Grades 9-12
174 Students
Public
Grades 9-12
117 Students

† Our analysis of utilities, groceries, transportation, healthcare, home prices, and other goods and services is sourced from the Cost of Living Index, a respected benchmark published by the Council for Community and Economic Research (C2ER) that provides a thorough overview of living expenses across different regions.
Rent data is provided by CoStar Group’s Market Trend reports. As the industry leader in commercial real estate information, analytics, and news, CoStar conducts extensive research to produce and maintain a comprehensive database of commercial real estate information. We combine this data with public record to provide the most up-to-date rental information available.
Consumer goods, services, and home prices are sourced from the Cost of Living Index published by the Council for Community and Economic Research (C2ER). The data on this page is updated quarterly. It was last published in June 2026.
Demographic information comes from Neustar and combines detailed address data with U.S. Census and American Community Survey statistics to produce reliable local estimates.


