
Sereno Canyon Falls
12000 FM 1171,
Northlake, TX 76262
$1,440 - $3,545
1-3 Beds

Located between Dallas and Fort Worth, Flower Mound combines suburban living with natural landscapes. The town's namesake, a 12.5-acre natural elevation covered in wildflowers, stands as a testament to the area's natural heritage. Current rental trends show average apartment rates ranging from $1,550 for studios to $3,223 for three-bedroom units, with modest year-over-year changes between -0.5% and 1.4%. The rental market includes communities near Lakeside DFW, Highland Village, and Parker Square.
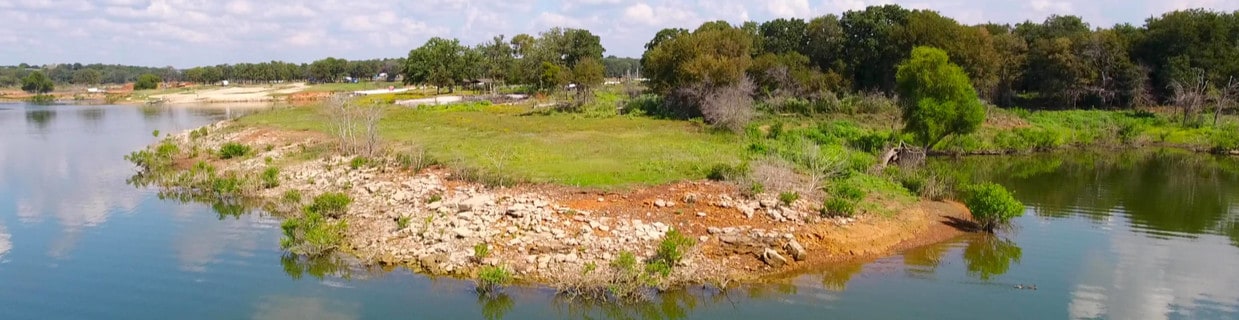
Grapevine Lake borders the town, providing waterfront recreation and scenic views. Through careful planning, Flower Mound maintains extensive green spaces while developing modern communities. The Lakeside Business District offers shopping and dining options, while Parker Square serves as a community gathering spot with its signature gazebo. The town features Texas Health Presbyterian Hospital and North Central Texas College's branch campus. With 54 public parks covering 693 acres, residents have access to outdoor spaces like Jake's Hilltop Park and the Hound Mound Dog Park. Established in the 1840s by Presbyterian settlers, Flower Mound holds the distinction of being Texas's largest municipality that maintains its designation as a "town" rather than a city.
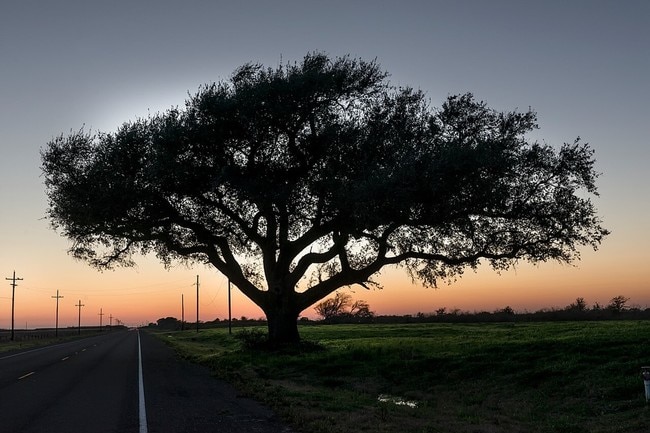
Sunset on Grapevine Lake
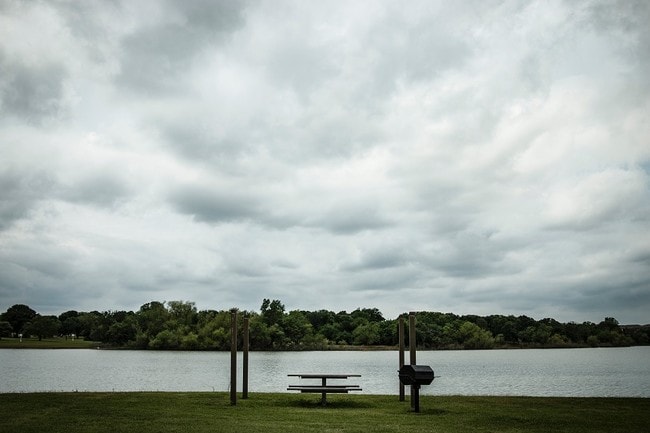
Grapevine Lake on a cloudy afternoon
As of March 2026, the average apartment rent in Flower Mound, TX is $1,484 for a studio, $1,761 for one bedroom, $2,692 for two bedrooms, and $3,181 for three bedrooms. Apartment rent in Flower Mound has increased by 0.1% in the past year.
Explore how walkable, bikeable, drivable, and transit-friendly Flower Mound, TX is for everyday living.
Car-Dependent
This area is considered a car-dependent area and most errands will require a car.
Minimal Transit
You'll likely want a car when living in this area since it has few transit options.
Somewhat Bikeable
You might be able to find places to ride your bike in this area, but you’ll most likely want your car for most errands.
Old Settlers Elementary School
Public
Grades PK-5

Public
Grades PK-5
Public
Grades PK-5

Public
Grades K-5
Public
Grades PK-5
Public
Grades 6-8
Public
Grades 6-8
Public
Grades 6-8
Public
Grades 6-8

Public
Grades 6-8

Public
Grades 9-12
Public
Grades 9-12
Public
Grades 9-12
Public
Grades 6-12


3,487
Communities
959,053
Units
894
Cities

101
Communities
30,819
Units
40
Cities

715
Communities
198,674
Units
340
Cities

61
Communities
20,955
Units
33
Cities

624
Communities
174,107
Units
247
Cities

196
Communities
70,873
Units
136
Cities
† Our analysis of utilities, groceries, transportation, healthcare, home prices, and other goods and services is sourced from the Cost of Living Index, a respected benchmark published by the Council for Community and Economic Research (C2ER) that provides a thorough overview of living expenses across different regions.
Rent data is provided by CoStar Group’s Market Trend reports. As the industry leader in commercial real estate information, analytics, and news, CoStar conducts extensive research to produce and maintain a comprehensive database of commercial real estate information. We combine this data with public record to provide the most up-to-date rental information available.
Consumer goods, services, and home prices are sourced from the Cost of Living Index published by the Council for Community and Economic Research (C2ER). The data on this page is updated quarterly. It was last published in February 2026.


