Median Age
38 Years
Largest Age Group
40-49 Years
Approximately 16% of Residents
Under 20
26%
Over 65
11%

Avg Rent
$1,440
Population
12,046
Renter Mix
47% Rent
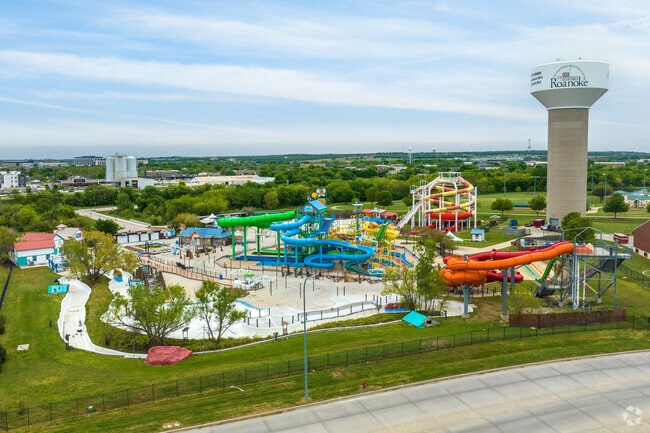
With top-notch schools like Roanoke Elementary School, well-kept city parks like Roanoke Community Park, and kid-friendly fun like the water park at Hawaiian Falls, the city of Roanoke is an excellent suburb. An array of chain and local dining options are available in Roanoke, including the Italian Bistro, serving the local community fine Italian cuisine for over seventeen years. If you’re in the mood for a steak or you’re a fan of garden-to-table cuisine, then the Classic at Roanoke, a local favorite for 25 years, is the place for you.
Several major roadways run through Roanoke, so it’s very accessible. Nearby amenities and attractions include Grapevine Lake and Meadowmere Park, a lakeside recreation area with beaches, boat ramps and docks, campgrounds, and more. Be sure to take your dog to nearby Bob Jones Park, or shop till you drop at Tanger Outlets Fort Worth. Roanoke is situated just 20 miles north of Fort Worth, making this city the perfect suburban getaway for commuters.
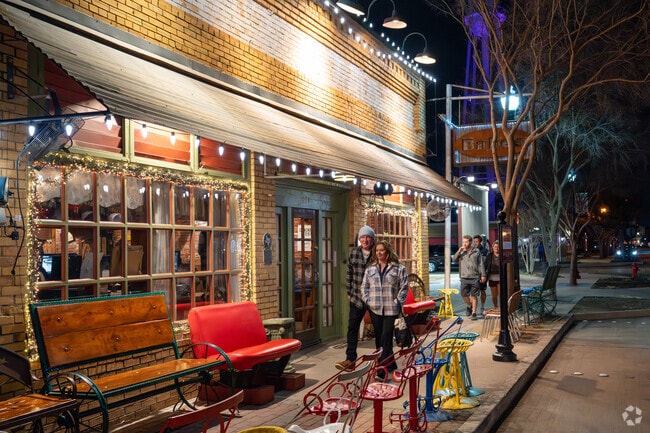
Downtown Roanoke has a well-lit, vibrant nightlife.
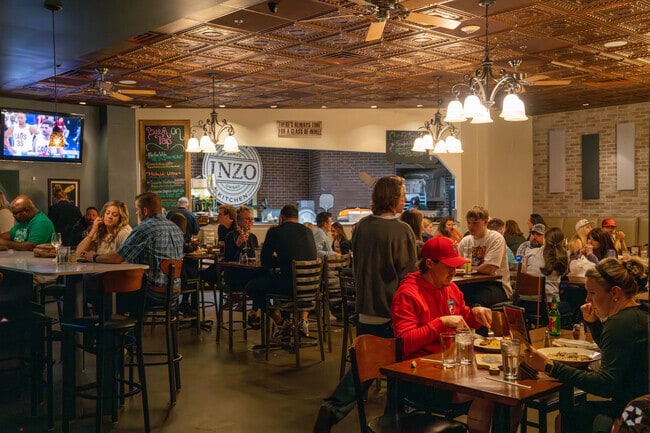
Inzos serves authentic Italian dishes for Roanoke residents.
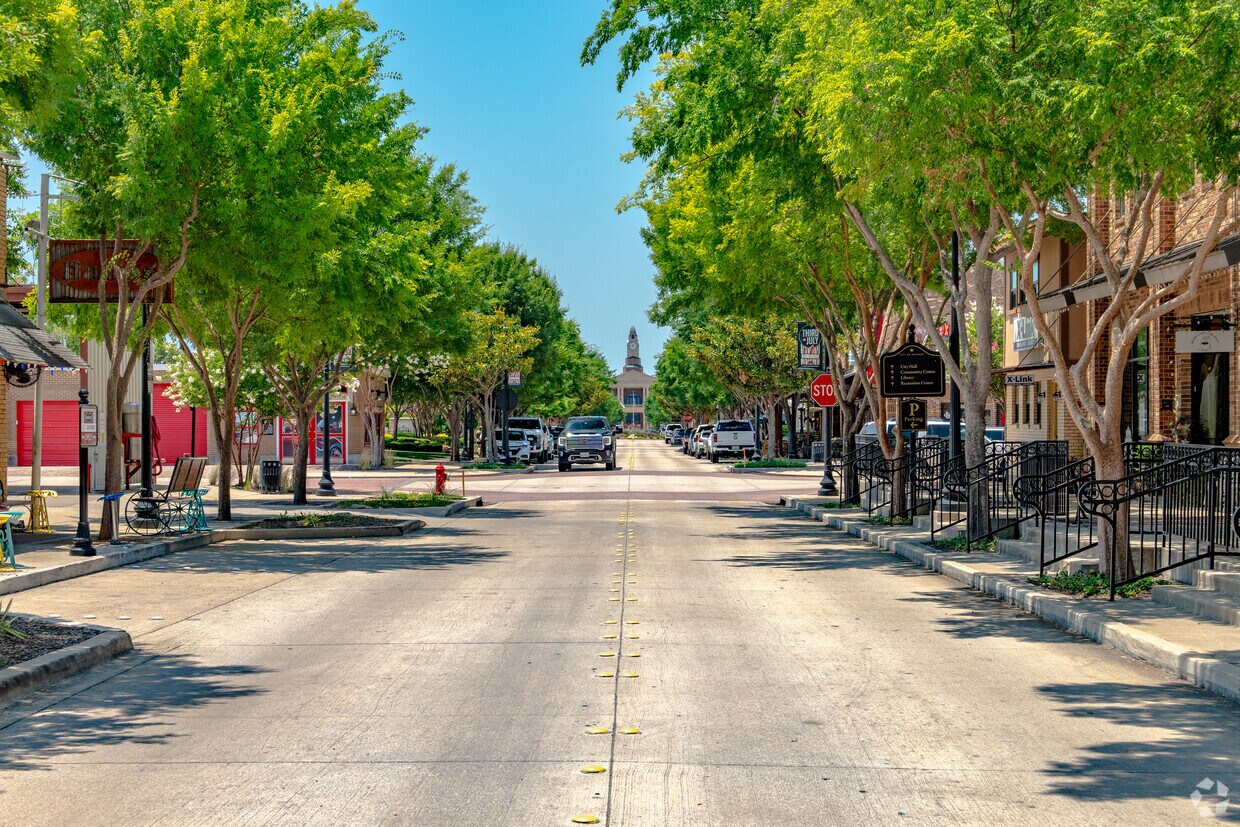
Downtown roads lead to the Roanoke Courthouse.
Discover natural beauty at the Roanoke Community Park.
Known as the unique dining capital of Texas, Roanoke is a food-lovers' dream come true.
Loved ones can enjoy time together with a relaxing at date at Evenings on Oak Street in Roanoke.
Median Household Income
$105,924
Average: $127,473
Education
4,195
Residents Have a Degree
Job Market
7,051
Workers Employed
Median Age
38 Years
Largest Age Group
40-49 Years
Approximately 16% of Residents
Under 20
26%
Over 65
11%
Housing Distribution
Roanoke has more homeowners than renters.

Education Distribution
Review this city's overall education levels.

As of July 2026, the average apartment rent in Roanoke, TX is $1,401 for a studio, $1,440 for one bedroom, $1,924 for two bedrooms, and $2,348 for three bedrooms. Apartment rent in Roanoke has decreased by 0.0% in the past year.
Explore how walkable, bikeable, drivable, and transit-friendly Roanoke, TX is for everyday living.
Somewhat Walkable
Walkability
Exceptionally Drivable
Drivability
Somewhat Bikeable
Bikeability
Public
Grades PK-5
484 Students

Public
Grades PK-5
697 Students

Public
Grades PK-5
702 Students

J Lyndal Hughes Elementary School
Public
Grades PK-5
669 Students
Public
Grades 6-8
1,039 Students
Public
Grades 6-8
1,039 Students

James M Steele Accelerated High School
Public
Grades 9-12
226 Students
† Our analysis of utilities, groceries, transportation, healthcare, home prices, and other goods and services is sourced from the Cost of Living Index, a respected benchmark published by the Council for Community and Economic Research (C2ER) that provides a thorough overview of living expenses across different regions.
Rent data is provided by CoStar Group’s Market Trend reports. As the industry leader in commercial real estate information, analytics, and news, CoStar conducts extensive research to produce and maintain a comprehensive database of commercial real estate information. We combine this data with public record to provide the most up-to-date rental information available.
Consumer goods, services, and home prices are sourced from the Cost of Living Index published by the Council for Community and Economic Research (C2ER). The data on this page is updated quarterly. It was last published in June 2026.
Demographic information comes from Neustar and combines detailed address data with U.S. Census and American Community Survey statistics to produce reliable local estimates.


