
Apartments on Main
128 West 3rd Street,
Davenport, IA 52801
$750 - $1,300
Studio - 1 Bed
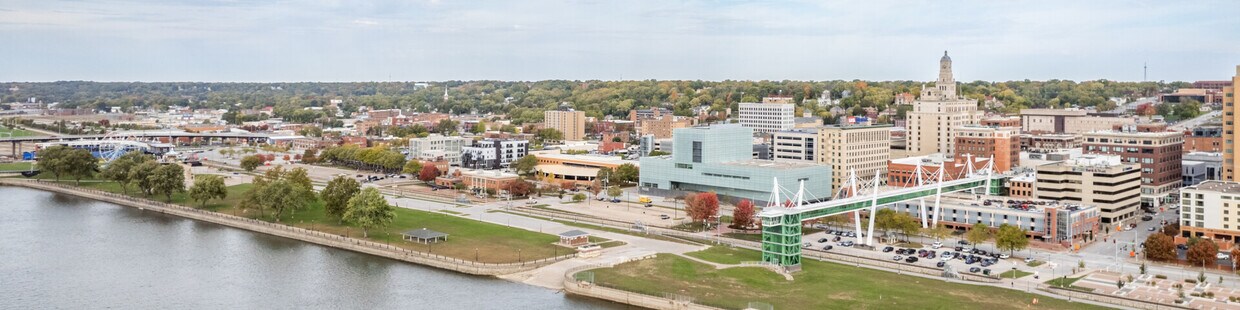

Davenport, situated along the Mississippi River, combines city living with natural surroundings. Downtown features the Figge Art Museum, the River Music Experience, and Modern Woodmen Park, where you can catch a Quad Cities River Bandits baseball game. The city maintains more than 50 parks and 20 miles of recreational paths, including Credit Island park with fishing areas and tennis courts, and Vander Veer Botanical Park, known for its conservatory and seasonal gardens. One-bedroom apartments rent for an average of $879, two-bedrooms for $1,023, and three-bedrooms for $1,670.
The city's architecture tells its story through neighborhoods like the Gold Coast Historic District and Hamburg Historic District, both showcasing preserved 19th-century homes. The Village of East Davenport adds to the city's character with local shops and dining options. St. Ambrose University and Palmer College of Chiropractic contribute to the area's educational landscape. Popular rental locations include the downtown district, areas along Duck Creek, and the neighborhood surrounding NorthPark Mall. The summer brings two notable events: the Bix Jazz Festival, honoring jazz legend Bix Beiderbecke, and the Bix 7 road race. Unlike other riverside cities, Davenport maintains open access to its riverfront instead of using permanent flood walls, allowing residents to enjoy recreational activities along the Mississippi.
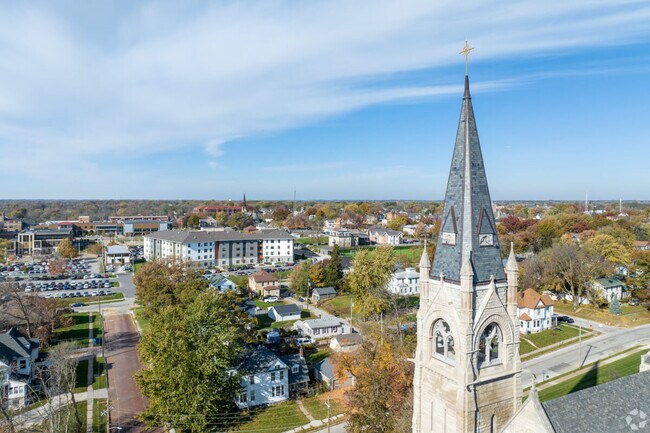
A historic church spire towers over Central Davenport.
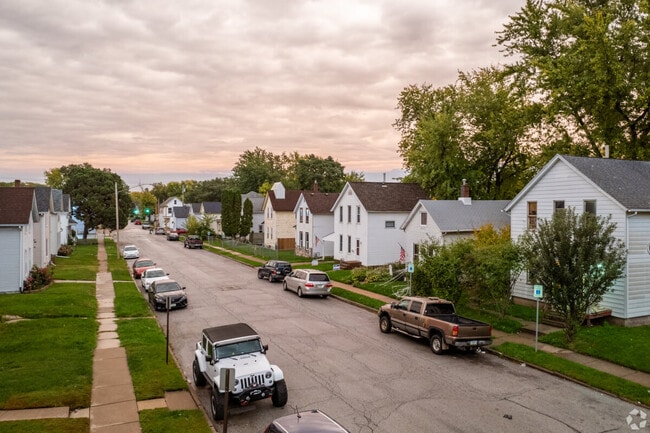
The sunset over a residential neighborhood in Davenport.
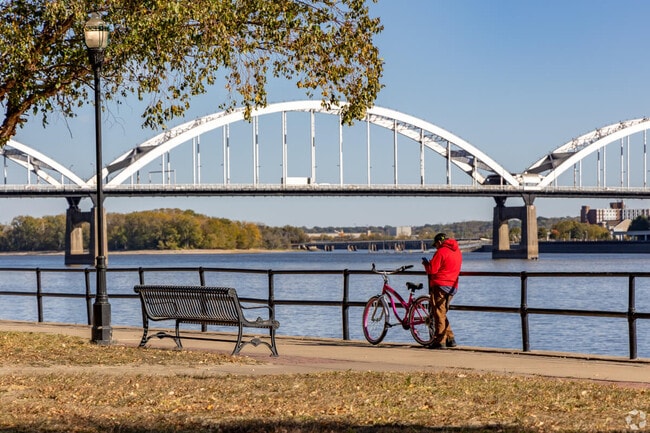
A man with a bike stands by the Mississippi River.
As of March 2026, the average apartment rent in Davenport, IA is $876 for a studio, $915 for one bedroom, $1,069 for two bedrooms, and $1,662 for three bedrooms. Apartment rent in Davenport has increased by 2.6% in the past year.
The cost of living in Davenport, IA is 9.1% lower than the national average. Generally, housing in Davenport is 19.1% less expensive than the national average, with rent falling between $876 - $1,662. You can expect to pay 2.8% less for groceries, 19.2% less for utilities, and 4.6% more for transportation.
Explore how walkable, bikeable, drivable, and transit-friendly Davenport, IA is for everyday living.
Fairly walkable
Walkability
Moderately drivable
Drivability
Fairly bikeable
Bikeability
Public
Grades K-6
508 Students

Public
Grades PK-6
401 Students

Public
Grades K-6
508 Students

Public
Grades K-6
413 Students
Public
Grades PK-6
381 Students
Public
Grades 7-8
524 Students

Public
Grades 7-8
438 Students
Public
Grades 7-8
423 Students
Public
Grades 7-8
313 Students

Public
Grades 6-7 & 11-12

Public
Grades 9-12
1,505 Students
Public
Grades 9-12
1,469 Students
Public
Grades 9-12
1,352 Students
Public
Grades 6-7 & 11-12
41
Communities
6,776
Units
11
Cities

11
Communities
902
Units
8
Cities

17
Communities
2,125
Units
8
Cities

53
Communities
6,543
Units
35
Cities

29
Communities
2,267
Units
10
Cities

315
Communities
76,967
Units
144
Cities
† Our analysis of utilities, groceries, transportation, healthcare, home prices, and other goods and services is sourced from the Cost of Living Index, a respected benchmark published by the Council for Community and Economic Research (C2ER) that provides a thorough overview of living expenses across different regions.
Rent data is provided by CoStar Group’s Market Trend reports. As the industry leader in commercial real estate information, analytics, and news, CoStar conducts extensive research to produce and maintain a comprehensive database of commercial real estate information. We combine this data with public record to provide the most up-to-date rental information available.
Consumer goods, services, and home prices are sourced from the Cost of Living Index published by the Council for Community and Economic Research (C2ER). The data on this page is updated quarterly. It was last published in February 2026.


