Median Age
37 Years
Largest Age Group
35-44 Years
Approximately 14% of Residents
Under 20
27%
Over 65
14%

Avg Rent
$1,355
Population
33,481
Renter Mix
38% Rent
Welcome to Clayton, North Carolina, a growing community located just 16 miles southeast of downtown Raleigh. This established town combines historic charm with contemporary living options, from preserved homes in the Clayton Historic District to new rental communities throughout the area.
Clayton's recreational spaces include an extensive network of parks and trails. The Clayton River Walk on the Neuse and the Sam's Branch Greenway Trail provide opportunities for walking, biking, and outdoor recreation. The 32,000-square-foot Clayton Community Center houses fitness facilities, while East Clayton Community Park offers soccer fields and a disc golf course. The Clayton Center, housed in the historic Clayton Graded School building, serves as a performing arts and conference venue in the heart of town. With convenient access to I-40 and US 70, residents can easily reach the Research Triangle while enjoying Clayton's community atmosphere.
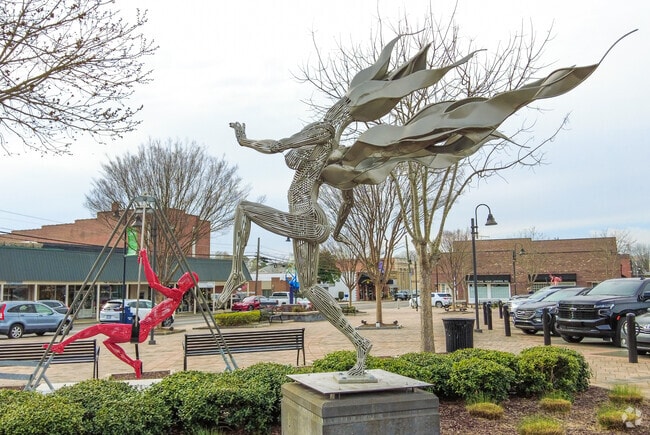
Circle Fountain in Riverwood
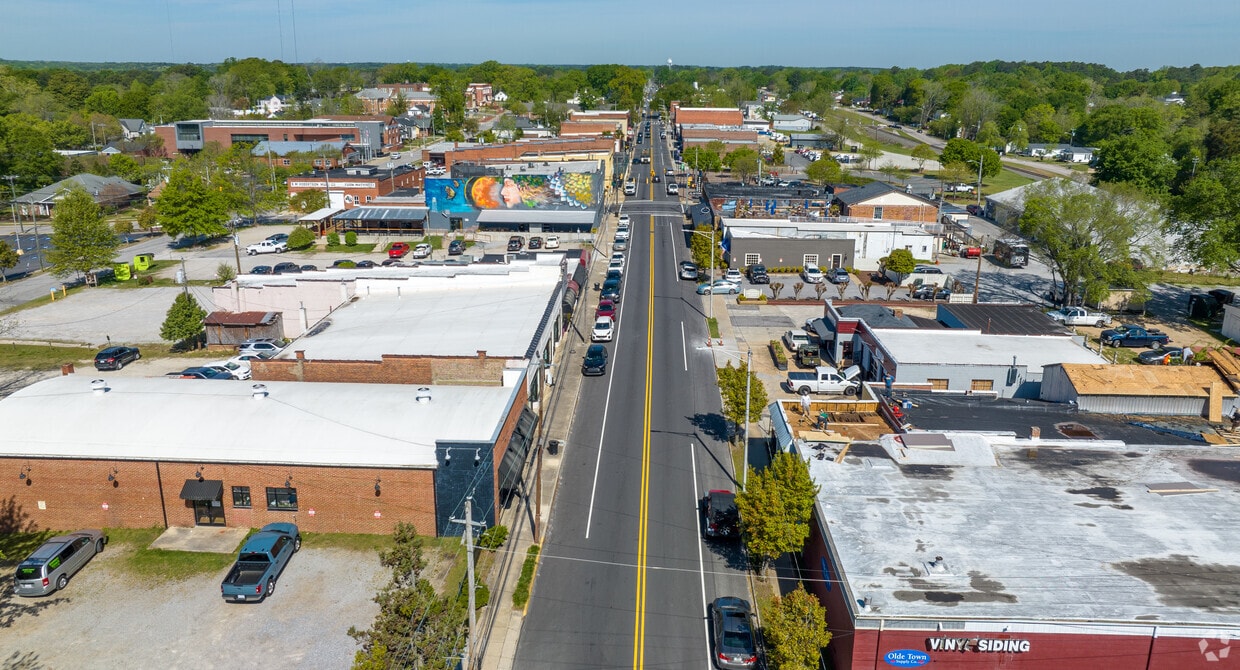
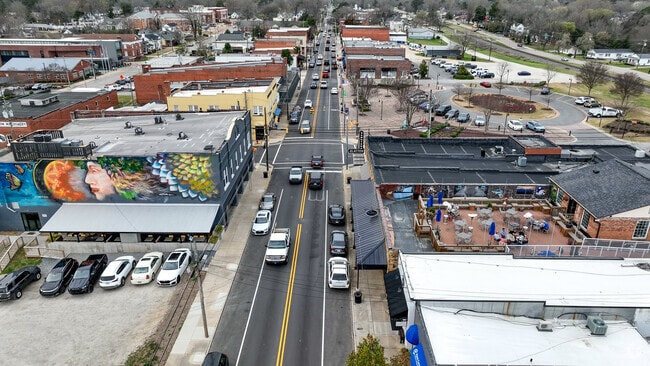
Downtown Clayton Main Street
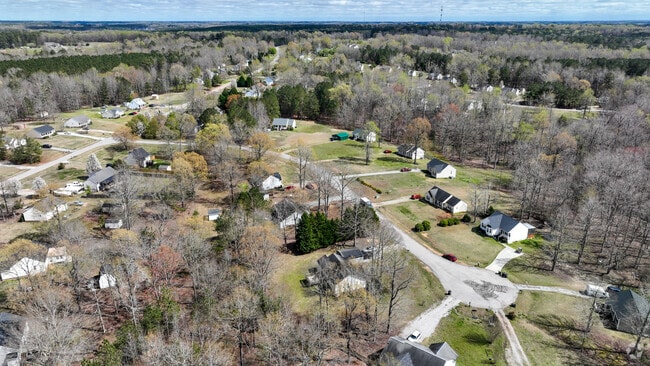
Lots of Green Space
Downtown Zebulon
Sitting Next to the Neuse River and Surrounded by Riverwood Golf Club, Riverwood Has a Lot to Offer for Outdoor Enthusiasts
9 Bar Coffee Shop at Riverwood
Median Household Income
$70,008
Average: $88,049
Education
8,324
Residents Have a Degree
Job Market
17,977
Workers Employed
Median Age
37 Years
Largest Age Group
35-44 Years
Approximately 14% of Residents
Under 20
27%
Over 65
14%
Housing Distribution
Clayton has more homeowners than renters.

Education Distribution
Review this city's overall education levels.

As of July 2026, the average apartment rent in Clayton, NC is $1,355 for one bedroom, $1,541 for two bedrooms, and $1,861 for three bedrooms. Apartment rent in Clayton has increased by 0.2% in the past year.
Explore how walkable, bikeable, drivable, and transit-friendly Clayton, NC is for everyday living.
Somewhat Walkable
Walkability
Exceptionally Drivable
Drivability
Not Bikeable
Bikeability
Public
Grades PK-5
810 Students

Public
Grades PK-5
623 Students
Public
Grades PK-5
922 Students

Public
Grades PK-5
822 Students

Public
Grades PK-5
444 Students

Public
Grades 6-8
750 Students
Public
Grades 6-8
573 Students
Public
Grades 6-8
919 Students

Public
Grades K-8
679 Students
Public
Grades 9-12
1,879 Students

Public
Grades 9-12
1,879 Students
Public
Grades 9-12
1,844 Students
† Our analysis of utilities, groceries, transportation, healthcare, home prices, and other goods and services is sourced from the Cost of Living Index, a respected benchmark published by the Council for Community and Economic Research (C2ER) that provides a thorough overview of living expenses across different regions.
Rent data is provided by CoStar Group’s Market Trend reports. As the industry leader in commercial real estate information, analytics, and news, CoStar conducts extensive research to produce and maintain a comprehensive database of commercial real estate information. We combine this data with public record to provide the most up-to-date rental information available.
Consumer goods, services, and home prices are sourced from the Cost of Living Index published by the Council for Community and Economic Research (C2ER). The data on this page is updated quarterly. It was last published in June 2026.
Demographic information comes from Neustar and combines detailed address data with U.S. Census and American Community Survey statistics to produce reliable local estimates.


