Median Age
41 Years
Largest Age Group
30-39 Years
Approximately 14% of Residents
Under 20
22%
Over 65
21%


Avg Rent
$1,347
Population
53,673
Renter Mix
43% Rent
Chicopee sits along the Connecticut River in Hampden County and ranks as the second-largest city in western Massachusetts. The city grew around its historic mill communities, and that industrial heritage is still visible today in its architecture and neighborhoods. Renters looking at apartments for rent in Chicopee will find a city with a strong economic base anchored by Westover Air Reserve Base, one of the area's largest employers, along with close proximity to the healthcare, education, and manufacturing sectors that drive the broader Springfield metropolitan region. Chicopee spans 24 square miles across several distinct neighborhoods, including Chicopee Center, Chicopee Falls, Willimansett, Fairview, and Aldenville. Renters can choose from garden-style apartment communities, walk-up units in older residential buildings, and updated multi-family homes throughout these areas. Shopping is convenient, with Chicopee Marketplace, Chicopee Crossing, and Fairview Shopping Plaza all within a short drive. Lake Lorraine State Park is close by for outdoor recreation, and a solid mix of local dining options makes everyday life a little more enjoyable. Commuting from Chicopee is straightforward whether you work in Springfield, Holyoke, or beyond. Interstate 90 (the Massachusetts Turnpike) and Interstate 291 both run through the city, keeping the wider region within easy reach. Amtrak service is available through the nearby Springfield and Holyoke stations, and Bradley International Airport is about 19 miles south via I-91. Several colleges — including American International College, Springfield College, and Holyoke Community College — are all within 15 minutes, making Chicopee a practical home base for anyone working or studying in the Pioneer Valley.
Chicopee has riverside views and trails that residents can enjoy during summer.
City Hall is a large stone structure in the Gothic Revival style.
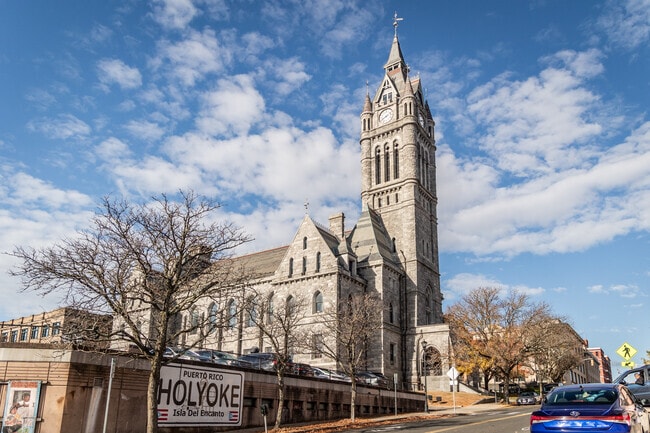
St. Stanislaus is a historic church on the edge of Downtown Chicopee.
Szot Park hosts many of the town's events.
Callaway Golf Co. produces more than 200,000 golf balls in Chicopee every day.
Since the ‘70s, industrial parks in Chicopee have become the homes of manufacturers.
Median Household Income
$58,192
Average: $72,560
Education
10,640
Residents Have a Degree
Job Market
25,954
Workers Employed
Median Age
41 Years
Largest Age Group
30-39 Years
Approximately 14% of Residents
Under 20
22%
Over 65
21%
Housing Distribution
Chicopee has more homeowners than renters.

Education Distribution
Review this city's overall education levels.

As of July 2026, the average apartment rent in Chicopee, MA is $1,225 for a studio, $1,352 for one bedroom, $1,573 for two bedrooms, and $1,848 for three bedrooms. Apartment rent in Chicopee has increased by 1.0% in the past year.
Explore how walkable, bikeable, drivable, and transit-friendly Chicopee, MA is for everyday living.
Fairly Walkable
Walkability
Limited Public Transit
Transit
Exceptionally Drivable
Drivability
Moderately Bikeable
Bikeability
General John Stefanik Elementary School
Public
Grades K-5
384 Students

Public
Grades K-5
239 Students

Public
Grades K-5
223 Students
Public
Grades K-5
425 Students

Public
Grades K-5
324 Students
Hampden Charter School Of Science
Public
Grades 6-12
958 Students
Public
Grades 6-8
684 Students

Public
Grades 6-8
766 Students

Public
Grades 6-8
766 Students
Hampden Charter School Of Science
Public
Grades 6-12
958 Students
Chicopee Comprehensive High School
Public
Grades 9-12
1,162 Students
Public
Grades 9-12
913 Students

Public
Grades 9-12
913 Students
Paulo Freire Social Justice Charter School
Public
Grades 9-12
261 Students

† Our analysis of utilities, groceries, transportation, healthcare, home prices, and other goods and services is sourced from the Cost of Living Index, a respected benchmark published by the Council for Community and Economic Research (C2ER) that provides a thorough overview of living expenses across different regions.
Rent data is provided by CoStar Group’s Market Trend reports. As the industry leader in commercial real estate information, analytics, and news, CoStar conducts extensive research to produce and maintain a comprehensive database of commercial real estate information. We combine this data with public record to provide the most up-to-date rental information available.
Consumer goods, services, and home prices are sourced from the Cost of Living Index published by the Council for Community and Economic Research (C2ER). The data on this page is updated quarterly. It was last published in June 2026.
Demographic information comes from Neustar and combines detailed address data with U.S. Census and American Community Survey statistics to produce reliable local estimates.


