Median Age
43 Years
Largest Age Group
15-24 Years
Approximately 13% of Residents
Under 20
23%
Over 65
23%
Avg Rent
$2,606
Population
14,051
Renter Mix
47% Rent
Carpinteria has quietly built a reputation as one of the Central Coast's most livable small cities, tucked between the Santa Ynez Mountains and the Pacific shoreline with just three square miles to call its own. The city earned the nickname "World's Safest Beach" as far back as 1912, a distinction rooted in the naturally sheltered cove that draws surfers and swimmers year-round. That easygoing coastal character shapes nearly every corner of town, from the laid-back pace along Linden Avenue to the salt-air backdrop behind everyday routines.
Situated midway between Santa Barbara and Ventura, Carpinteria offers access to two larger metro areas without giving up its small-town identity. The local economy draws from agriculture, including some of the most productive greenhouse and cut-flower operations in California, alongside tourism and the proximity to regional employers in neighboring cities. The University of California, Santa Barbara sits just a short drive up the coast, adding an educational anchor to the broader area.
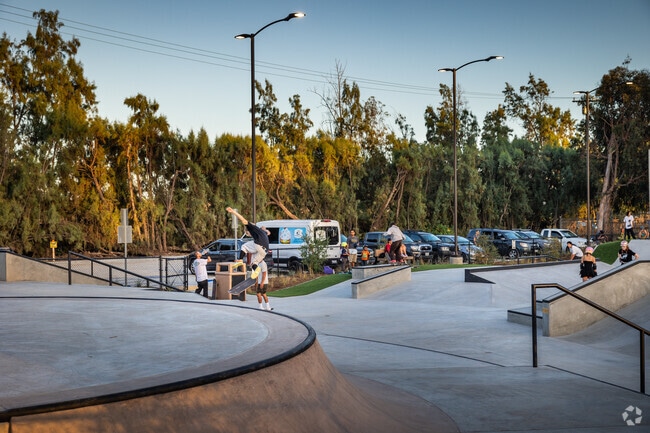
Residents love to hang out with their friends at the Carpinteria Skate Park in Carpinteria.
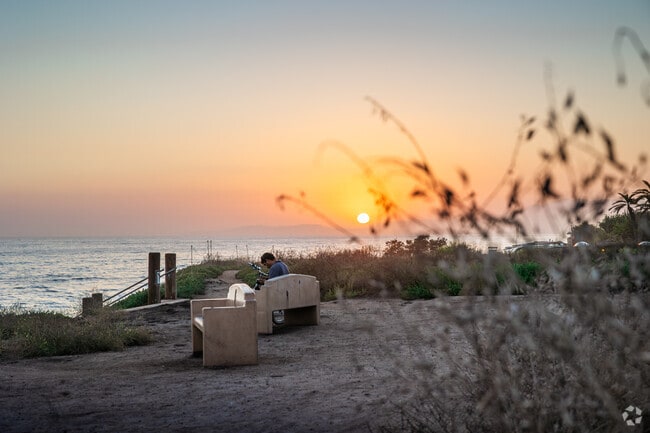
Enjoy the sunset at Carpinteria Bluffs Nature Preserve in Carpinteria.
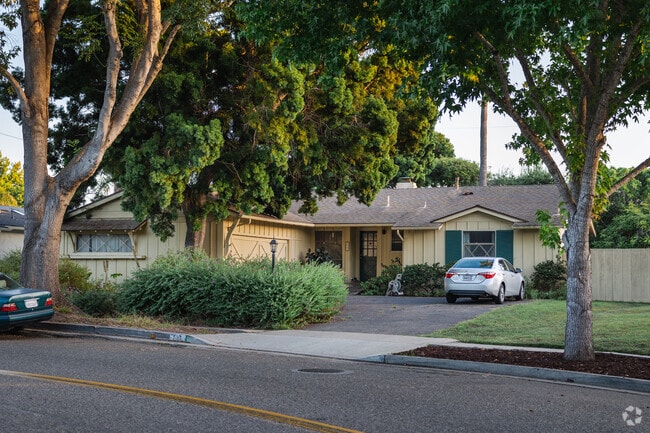
Ranch-Style home seen at golden hour in Carpinteria.
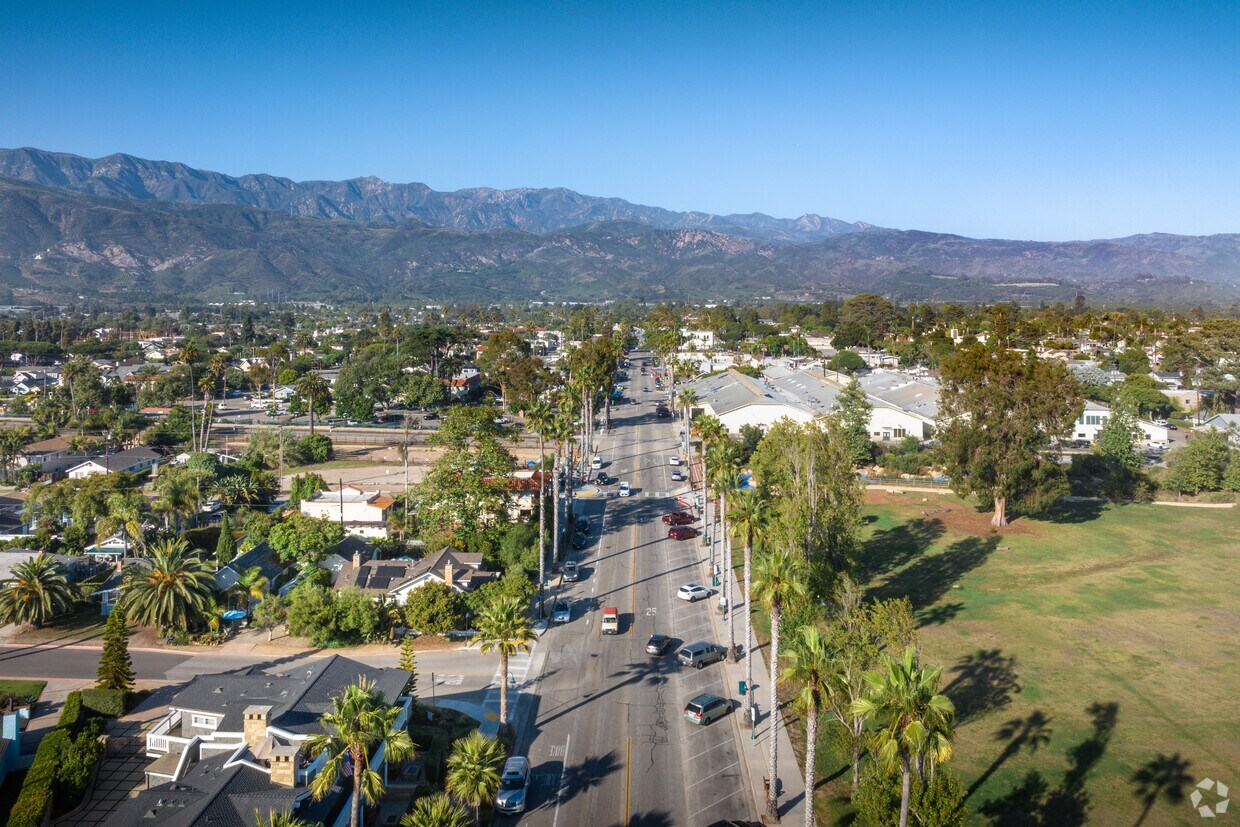
A hazy aerial view looking up the coast from Carpinteria.
Carpinteria can be your new community.
Large mural painted along Linden Ave in Carpinteria.
Median Household Income
$90,494
Average: $125,968
Education
4,624
Residents Have a Degree
Job Market
7,342
Workers Employed
Median Age
43 Years
Largest Age Group
15-24 Years
Approximately 13% of Residents
Under 20
23%
Over 65
23%
Housing Distribution
Carpinteria has more homeowners than renters.

Education Distribution
Review this city's overall education levels.

As of July 2026, the average apartment rent in Carpinteria, CA is $2,606 for one bedroom, $3,237 for two bedrooms, and $3,943 for three bedrooms. Apartment rent in Carpinteria has increased by 2.7% in the past year.
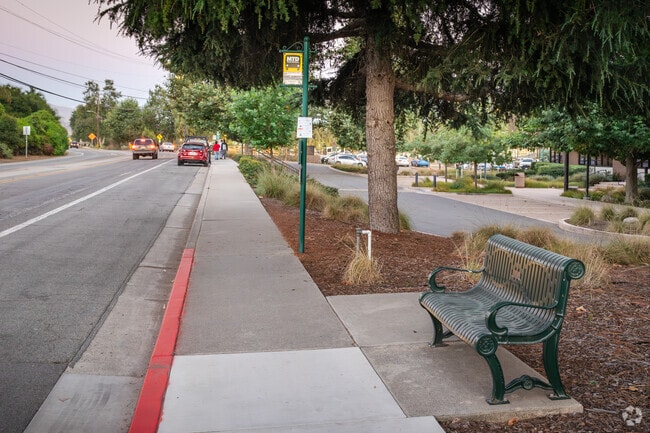
Explore how walkable, bikeable, drivable, and transit-friendly Carpinteria, CA is for everyday living.
Fairly Walkable
Walkability
Limited Public Transit
Transit
Exceptionally Drivable
Drivability
Somewhat Bikeable
Bikeability
Public
Grades K-5
45 Students

Public
Grades K-5
471 Students

Public
Grades K-5
471 Students
Public
Grades K-5
315 Students

Public
Grades K-5
315 Students
Public
Grades 6-8
437 Students

Public
Grades 6-8
437 Students
Carpinteria Senior High School
Public
Grades 9-12
593 Students

Public
Grades 9-12
593 Students
† Our analysis of utilities, groceries, transportation, healthcare, home prices, and other goods and services is sourced from the Cost of Living Index, a respected benchmark published by the Council for Community and Economic Research (C2ER) that provides a thorough overview of living expenses across different regions.
Rent data is provided by CoStar Group’s Market Trend reports. As the industry leader in commercial real estate information, analytics, and news, CoStar conducts extensive research to produce and maintain a comprehensive database of commercial real estate information. We combine this data with public record to provide the most up-to-date rental information available.
Consumer goods, services, and home prices are sourced from the Cost of Living Index published by the Council for Community and Economic Research (C2ER). The data on this page is updated quarterly. It was last published in June 2026.
Demographic information comes from Neustar and combines detailed address data with U.S. Census and American Community Survey statistics to produce reliable local estimates.


