
Living at NoHo
11059 McCormick St,
North Hollywood, CA 91601
$2,035 - $4,290 Total Monthly Price
Studio - 3 Beds
Living in Burbank combines entertainment industry heritage with comfortable suburban living. As home to Warner Bros., Disney, and Netflix, the city's entertainment legacy shapes its character. The rental market currently shows average monthly rates ranging from $1,960 for studios to $5,337 for four-bedroom units, with moderate year-over-year increases ranging from 0.3% to 6.6%. One-bedroom apartments average $2,287, reflecting a 2.2% annual increase.
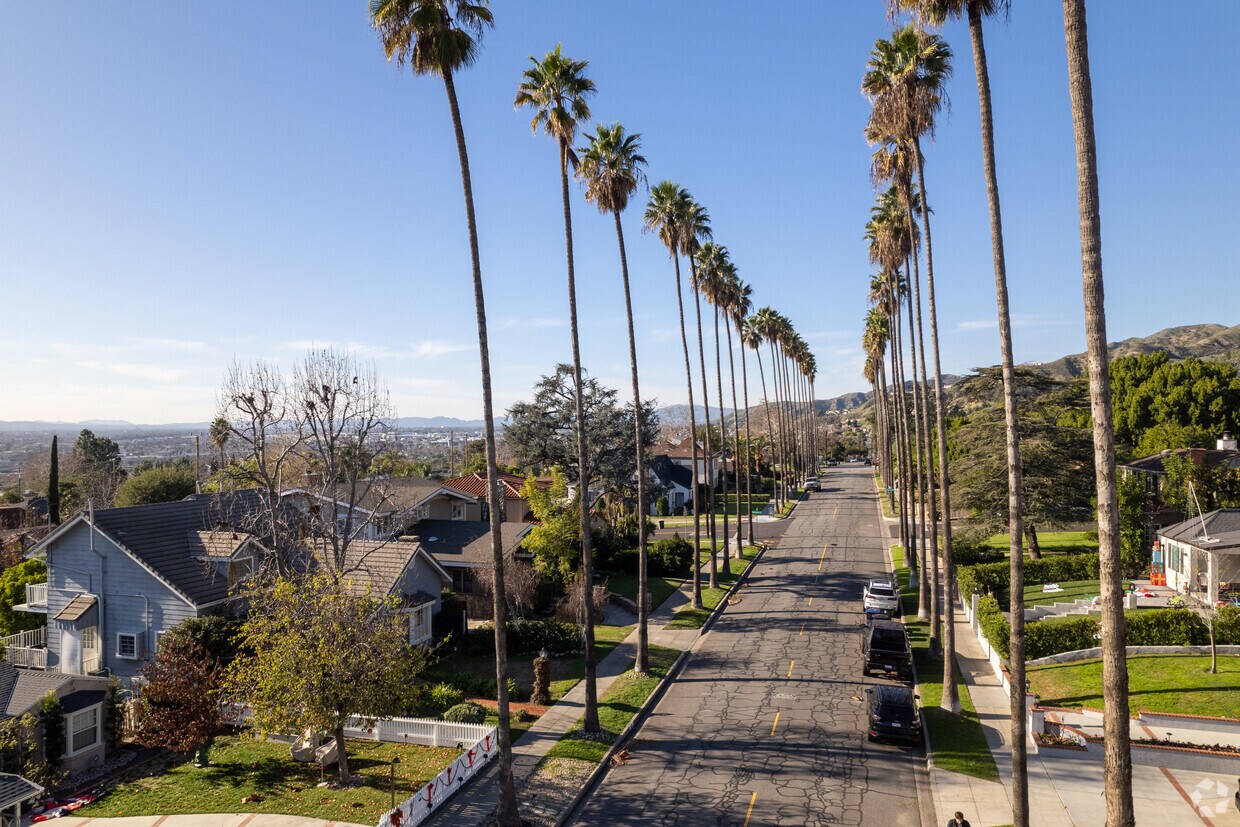
Each Burbank neighborhood has its own character - from the Rancho district with its equestrian zoning to Magnolia Park, where vintage shops and local boutiques line the streets. Outdoor spaces include Johnny Carson Park and the Chandler Bikeway, which connects residents to various parts of the city. The Media District houses major studios, while downtown features shopping at Burbank Town Center and an array of restaurants along San Fernando Boulevard. The city's aviation history includes the former Lockheed Skunk Works facility, where aerospace innovations like the U-2 reconnaissance aircraft were developed. Today, the Hollywood Burbank Airport provides convenient travel options, while the city's public schools and walkable neighborhoods continue to attract new residents.
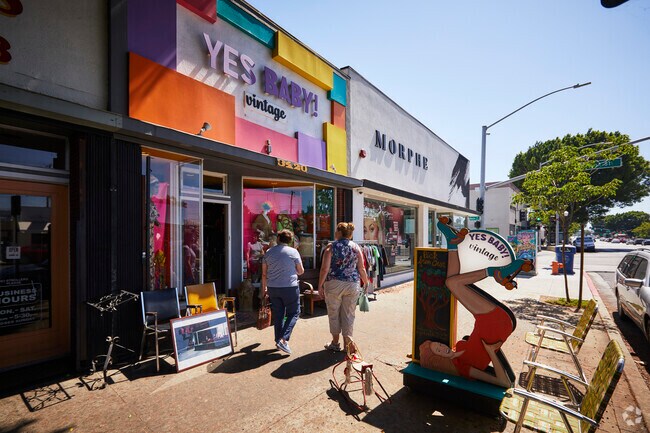
Downtown Burbank offers tons of great shopping destinations.
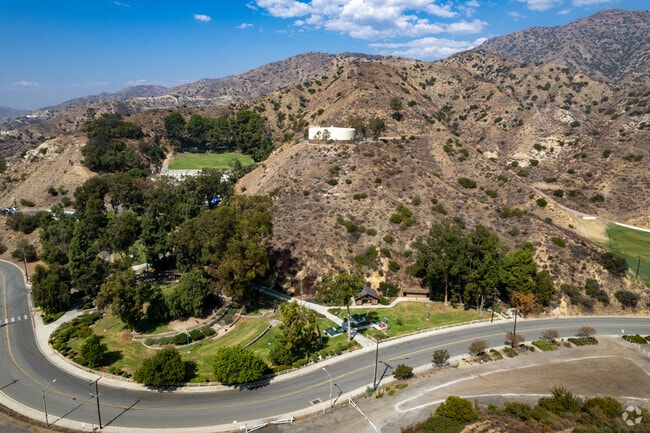
Starlight Bowl Concert Hall theater in the mountains.
Palm Avenue brings a mixed-use shopping center to Burbank, with ample shopping and dining.
Burbank Town Center is the city's major mall.
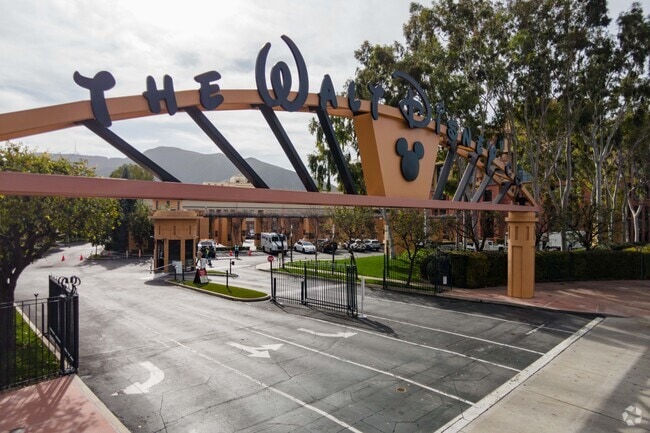
Gates to Disney
Shopping on a sunny afternoon in Benmar.
As of March 2026, the average apartment rent in Burbank, CA is $1,901 for a studio, $2,229 for one bedroom, $2,924 for two bedrooms, and $3,935 for three bedrooms. Apartment rent in Burbank has decreased by -0.9% in the past year.
Explore how walkable, bikeable, drivable, and transit-friendly Burbank, CA is for everyday living.
Very Walkable
If you enjoy walking, you’ll enjoy renting in this area! It’s a very walkable neighborhood.
Some Transit
You'll likely want a car when living in this area since it has few transit options.
Bikeable
While there’s some bike infrastructure in this area, you’ll still need a car for many errands.
Public
Grades K-5

Public
Grades K-5

Public
Grades K-5
Public
Grades K-5
Public
Grades K-5
Public
Grades 6-8
Public
Grades 6-8

Public
Grades 6-8

Burbank Unified Independent Learning Academy (BUILA)
Public
Grades K-12
Public
Grades 6-12

Public
Grades 9-12
Public
Grades 9-12
Burbank Unified Independent Learning Academy (BUILA)
Public
Grades K-12
Public
Grades 9-12

Public
Grades 6-12

19
Communities
866
Units
4
Cities

3,490
Communities
959,386
Units
895
Cities

17
Communities
716
Units
9
Cities

15
Communities
376
Units
7
Cities

64
Communities
1,427
Units
17
Cities

197
Communities
71,233
Units
136
Cities
† Our analysis of utilities, groceries, transportation, healthcare, home prices, and other goods and services is sourced from the Cost of Living Index, a respected benchmark published by the Council for Community and Economic Research (C2ER) that provides a thorough overview of living expenses across different regions.
Rent data is provided by CoStar Group’s Market Trend reports. As the industry leader in commercial real estate information, analytics, and news, CoStar conducts extensive research to produce and maintain a comprehensive database of commercial real estate information. We combine this data with public record to provide the most up-to-date rental information available.
Consumer goods, services, and home prices are sourced from the Cost of Living Index published by the Council for Community and Economic Research (C2ER). The data on this page is updated quarterly. It was last published in February 2026.


