Safe Neighborhoods for Renters in Brooklyn
If safety is a factor in your move to New York's busiest borough, here are some of Brooklyn's safest neighborhoods.


Home to more than 2.6 million residents, Brooklyn is busy, diverse, and constantly growing. Living in Brooklyn gives you access to art, culture, international cuisine, and yearly celebrations. The borough is packed with bars, pop-up art galleries, boutiques, symphony halls, and museums.
Even though Brooklyn is fast-paced and trendy, it is still less expensive than living in New York City. You can save about 10 percent by choosing to rent in Brooklyn over other New York City locales. For example, a one-bedroom apartment in Brooklyn will cost you an average of $2,256. In New York City, a one-bedroom averages $5,813. However, Brooklyn is far from cheap. In fact, it’s one of the most expensive cities in the nation, with the average house costing about $750,000, compared to the national average of $428,000.
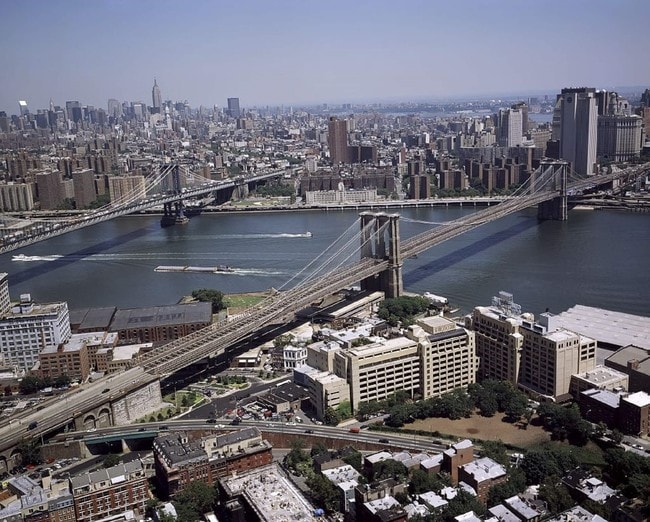
Cost aside, Brooklyn continues to attract new residents because of its location on the waterfront, endless supply of things to do, easy access to the subway, unparalleled walkability, amazing architecture that includes iconic brownstones, and terrific food. You’ll live in a place famous for attractions like the Brooklyn Bridge, Coney Island, and Prospect Park.
The Brooklyn scenery is also grand, containing some of New York’s most attractive parks and landmarks like Grand Army Plaza, the Brooklyn Museum, and the Brooklyn Botanic Garden. If you’re craving a bite of the Big Apple, living in Brooklyn will put you in the heart of it all.
The historic Brooklyn Bridge was completed in 1883
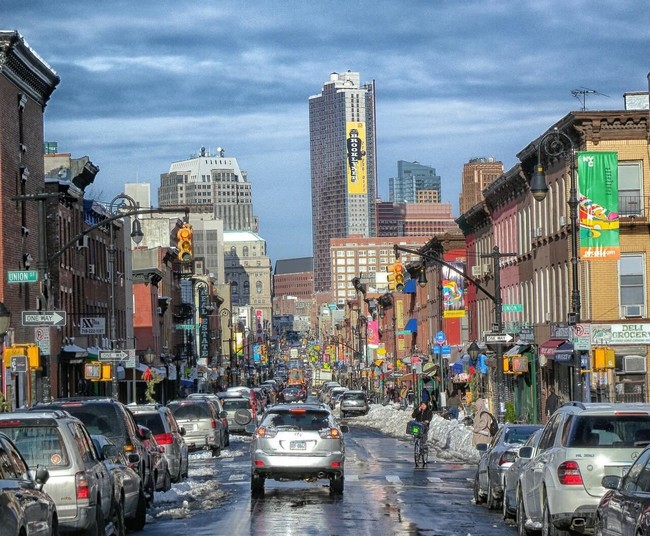
Busy street in Brooklyn
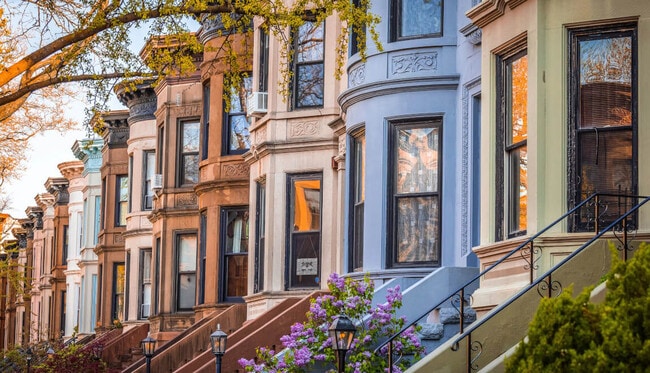
Brownstones in Brooklyn's Park Slope neighborhood
As of February 2026, the average apartment rent in Brooklyn, NY is $2,668 for a studio, $2,988 for one bedroom, $3,921 for two bedrooms, and $4,837 for three bedrooms. Apartment rent in Brooklyn has increased by 1.2% in the past year.
The cost of living in Brooklyn, NY is 63.9% higher than the national average. Generally, housing in Brooklyn is 181.4% more expensive than the national average, with rent falling between $2,668 - $4,837. You can expect to pay 15.2% more for groceries, 17.2% more for utilities, and 10.2% more for transportation.
If safety is a factor in your move to New York's busiest borough, here are some of Brooklyn's safest neighborhoods.
Experience all Brooklyn offers without breaking the bank. Explore our detailed guide to moving to Brooklyn on a budget.
Find your ideal NYC borough! Compare Manhattan's energy, Brooklyn's vibe, and more to decide the best spot for your next apartment.
Exploring your options in the Big Apple? Discover the best parts of New York City with our detailed guide.
Thinking about moving to Brooklyn? Here are some pros and cons of living in Brooklyn to help you decide.
Walker's Paradise
out of 100 WalkScore® Rating
Lace up your walking shoes because this area is considered a walker’s paradise.
Rider's Paradise
out of 100 TransitScore® Rating
Living in this area is considered a rider’s paradise, with world-class transportation.
Very Bikeable
out of 100 BikeScore® Rating
This area is very bikeable. You’ll find a variety of bike paths and lanes.
Public
Grades PK-5
656 Students

Public
Grades PK-5
499 Students
Public
Grades PK-5
498 Students
Public
Grades PK-5
922 Students

Public
Grades PK-5
716 Students
Mark Twain is 239 for the Gifted and Talented
Public
Grades 6-8
1,297 Students
Public
Grades 6-8
1,030 Students
New Voices School Of Academic And Creative Arts
Public
Grades 6-8
547 Students
MS 442 Carroll Gardens School for Innovation
Public
Grades 6-8
338 Students
Public
Grades 6-8
153 Students
Brooklyn Technical High School
Public
Grades 9-12
5,850 Students
Public
Grades 9-12
772 Students
Millennium Brooklyn High School
Public
Grades 9-12
681 Students
Public
Grades 9-12
634 Students
Brooklyn Preparatory High School
Public
Grades 9-12
587 Students
† Our analysis of utilities, groceries, transportation, healthcare, home prices, and other goods and services is sourced from the Cost of Living Index, a respected benchmark published by the Council for Community and Economic Research (C2ER) that provides a thorough overview of living expenses across different regions.
Rent data is provided by CoStar Group’s Market Trend reports. As the industry leader in commercial real estate information, analytics, and news, CoStar conducts extensive research to produce and maintain a comprehensive database of commercial real estate information. We combine this data with public record to provide the most up-to-date rental information available.
Consumer goods, services, and home prices are sourced from the Cost of Living Index published by the Council for Community and Economic Research (C2ER). The data on this page is updated quarterly. It was last published in February 2026.