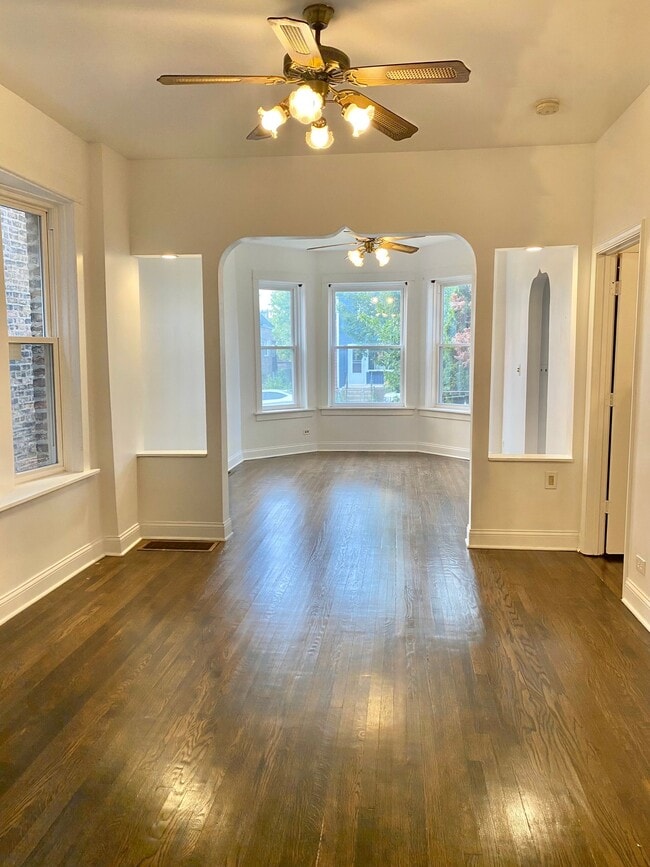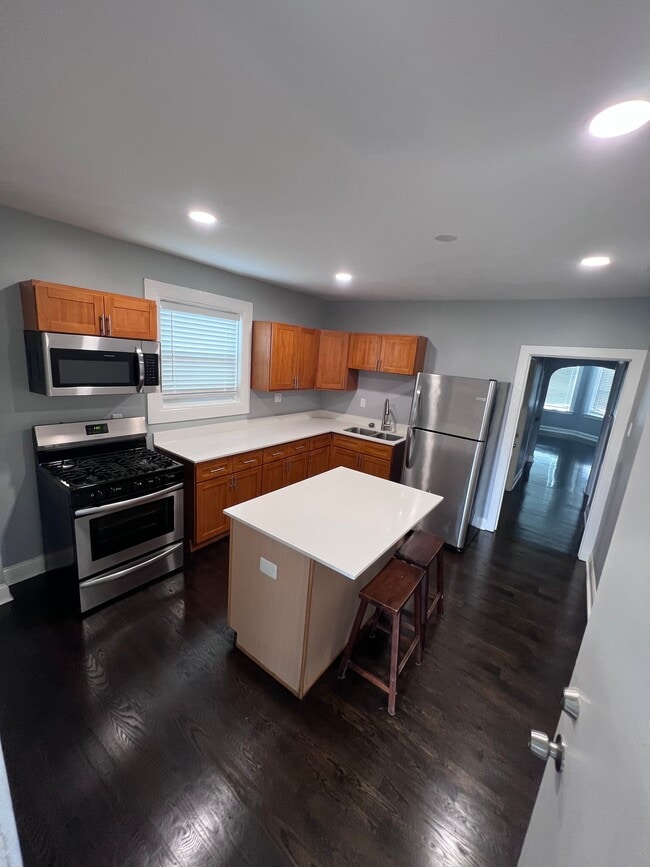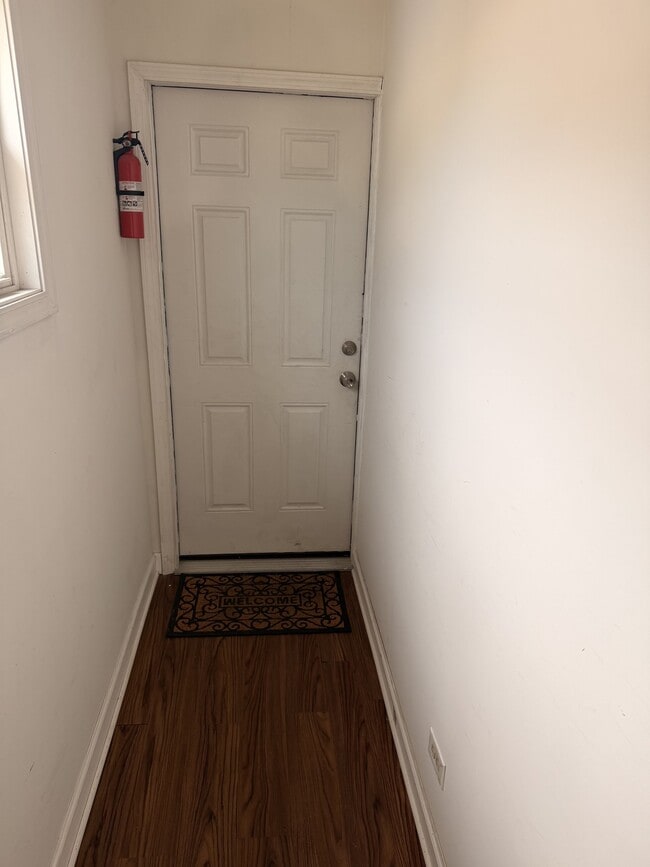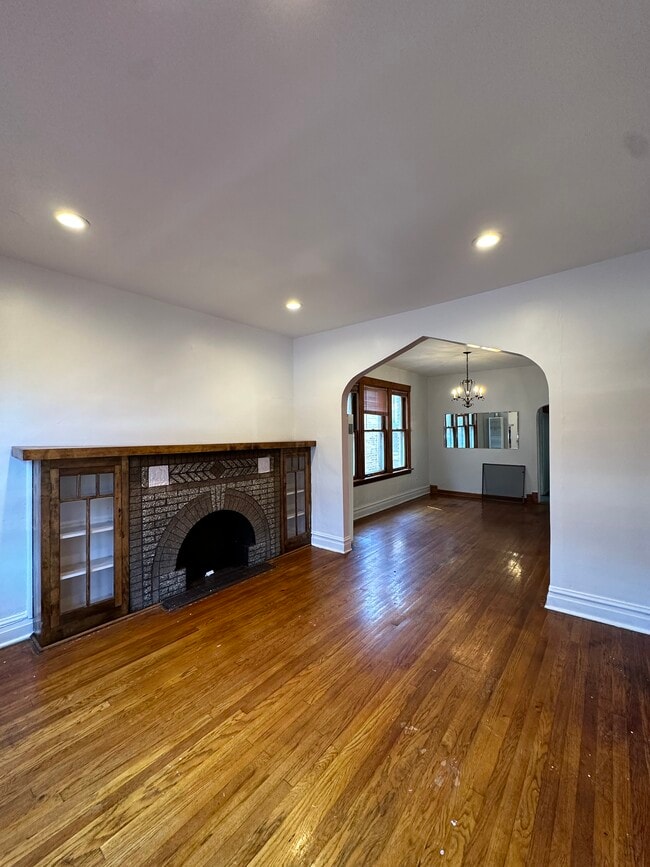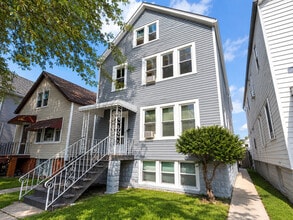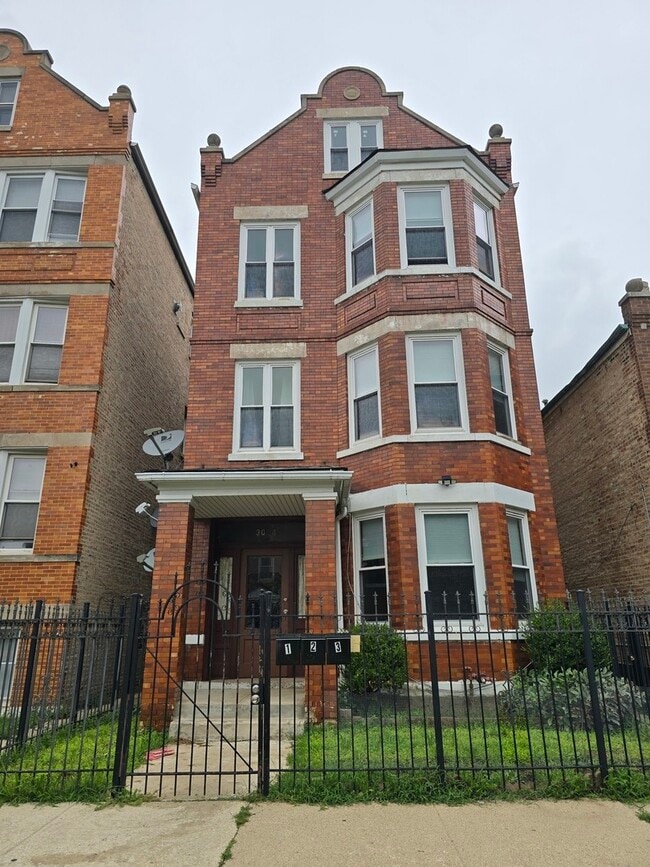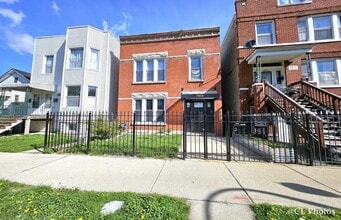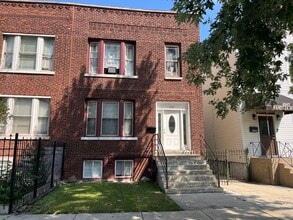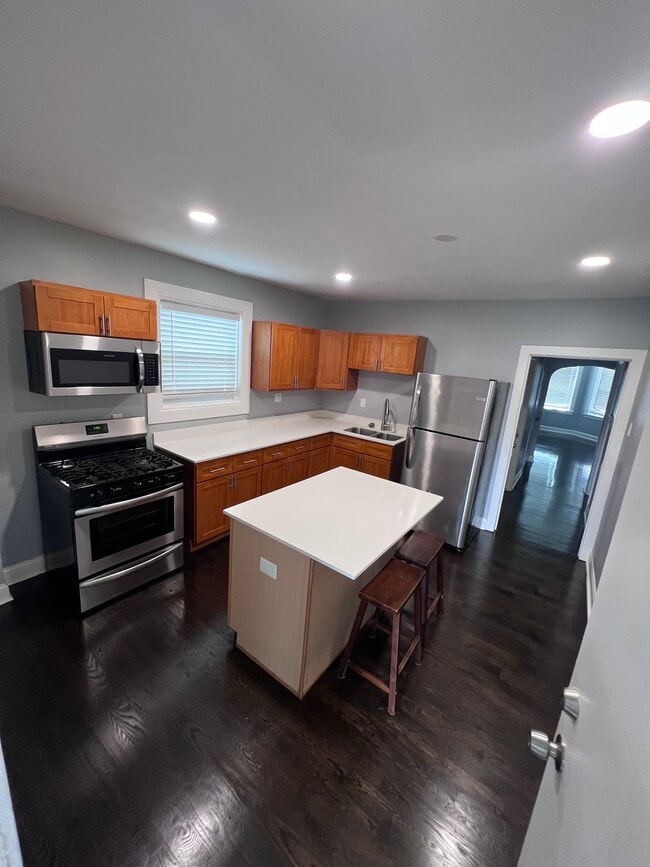
4343 S Spaulding Ave
4343 S Spaulding Ave,
Chicago, IL 60632
$1,850 Total Monthly Price
2 Beds | 3 Month Lease

Area Guide
Brighton Park is a unique blend of residential homes and apartments, commercial buildings, and industrial zones. There are two railroad landmarks that make up Brighton Park’s transportation gateway: Corwith Intermodal Facility and Brighton Park Crossing. Residents enjoy the convenient access to Interstate 55 and the Chicago Transit Authority’s Orange Line.
South Archer Avenue is your go-to road for local restaurants, convenience stores, and banks. Brighton Park’s own Kelly Park provides residents with outdoor recreational opportunities, as does nearby McKinley Park. Chicago Midway International Airport is four miles away.
As of August 2026, the average apartment rent in Brighton Park is $890 for one bedroom, $945 for two bedrooms, and $989 for three bedrooms. Apartment rent in Brighton Park has increased by 4.1% in the past year.
1 BR
539 sq ft
Average Sq Ft
$890/month
Average Rent
2 BR
638 sq ft
Average Sq Ft
$945/month
Average Rent
3 BR
824 sq ft
Average Sq Ft
$989/month
Average Rent
Explore how walkable, bikeable, drivable, and transit-friendly Brighton Park - Chicago, IL is for everyday living.
Exceptionally Walkable
Walkability
Some Public Transit
Transit
Moderately Drivable
Drivability
Fairly Bikeable
Bikeability
In Brighton Park - Chicago, IL, daily errands are quick and hassle-free.
Supermarket Within a 5 Minute Walk
Groceries
Great Restaurant Variety Nearby
Restaurants
Good Café Variety Nearby
Cafes
Great Variety of Shops Nearby
Shopping
Brighton Park - Chicago, IL provides green space and wellness resources in certain areas.
Very Large Amount of Park Space Nearby
Parks
Fair Wellness Amenity Variety Nearby
Wellness
Get a sense of what it’s like to live in Brighton Park - Chicago, IL from everyday activity to noise and nightlife.
Vibrant Atmosphere at Times
Vibrancy
Good Nightlife Variety Nearby
Nightlife
Not Noisy
Quiet Score


Current Resident
1 years and 7 months ago•Niche Review
Growing up in Brighton Park, I have grown a lot of mixed feelings. It isn't the safest, but us Latinos are connected. Whether it be the small shops, restaurants, or the schools, we are all a community of hardworking individuals. I wish gang and gun violence can settle down, as one of my elementary classmates passed away a few years ago due to it all.
Current Resident
1 years and 10 months ago•Niche Review
I grew up living in this neighborhood. I'm used to the traffic, night life and crime. The crime rates have been higher now, but usually things are okay as long as you don't get into any issues with anyone.
Current Resident
3 years and 4 months ago•Niche Review
My neighborhood is in the southside of Chicago, so there is always a lot going on. On a regular basis, there would be gunshots and I would hear about crime around the area of where I live. However, it is a great neighborhood in a different sense because of its convenience. There are many restaurants, fast-food places, even grocery stores around for all people to access.
Current Resident
4 years and 2 months ago•Niche Review
It's okay neighborhood with mostly friendly people. I wish there was more active people looking out for each other. My dog was stolen a couple months back and none of my neighbors offered to search or look at their security cameras.
† Our analysis of utilities, groceries, transportation, healthcare, home prices, and other goods and services is sourced from the Cost of Living Index, a respected benchmark published by the Council for Community and Economic Research (C2ER) that provides a thorough overview of living expenses across different regions.
Rent data is provided by CoStar Group’s Market Trend reports. As the industry leader in commercial real estate information, analytics, and news, CoStar conducts extensive research to produce and maintain a comprehensive database of commercial real estate information. We combine this data with public record to provide the most up-to-date rental information available.
Consumer goods, services, and home prices are sourced from the Cost of Living Index published by the Council for Community and Economic Research (C2ER). The data on this page is updated quarterly. It was last published in June 2026.
Demographic information comes from Neustar and combines detailed address data with U.S. Census and American Community Survey statistics to produce reliable local estimates.