Median Age
43 Years
Largest Age Group
40-49 Years
Approximately 15% of Residents
Under 20
22%
Over 65
19%
Area Guide
Avg Rent
$3,030
Population
26,328
Renter Mix
41% Rent
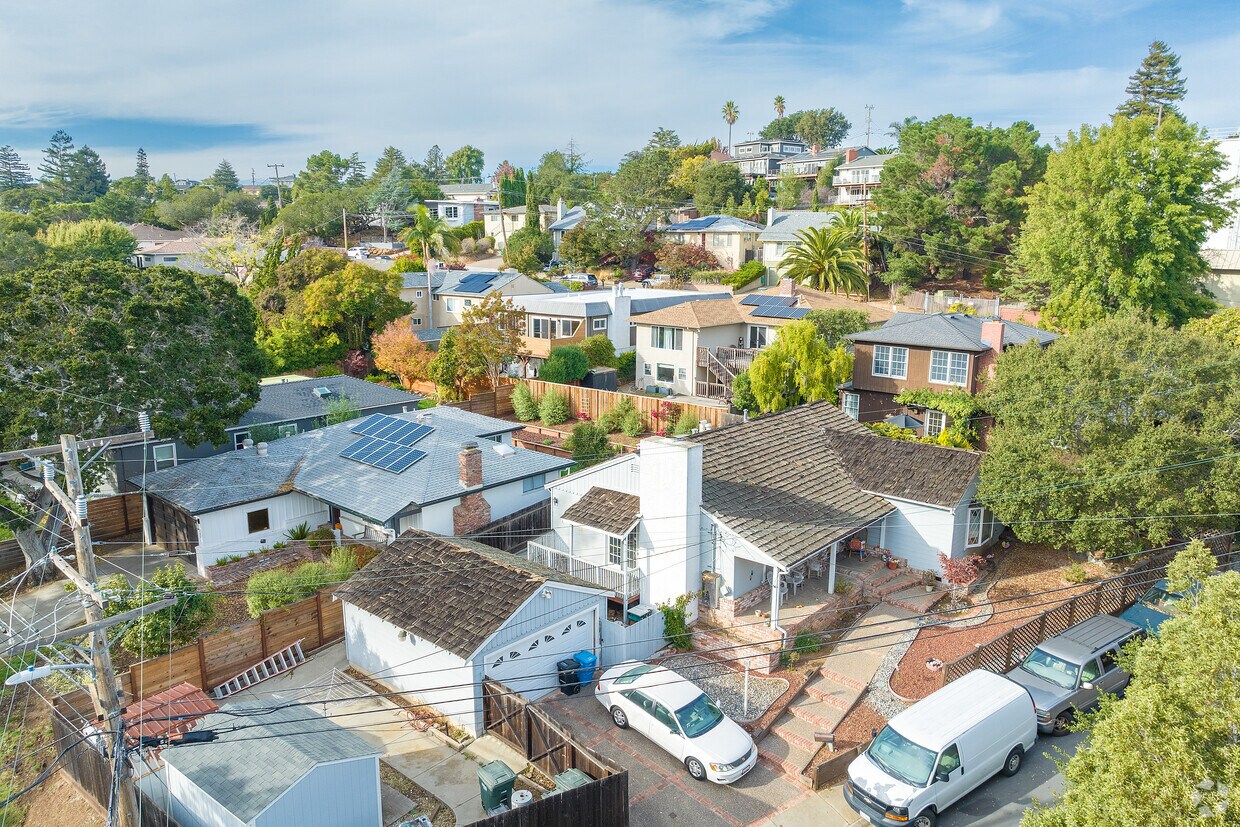
Situated midway between San Francisco and San Jose, Belmont is a tranquil community known for its wooded hills, vast stretches of open space, and expansive views of the San Francisco Bay. Belmont’s pervasive natural beauty and laidback atmosphere provide a calm reprieve from the bustle of city life.
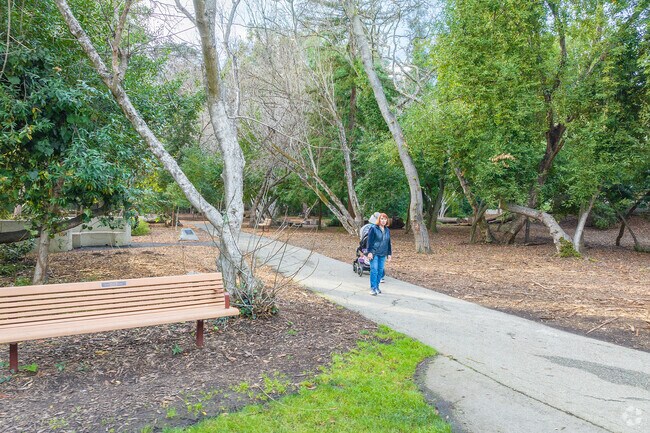
Residents often flock to Twin Pines Park, Water Dog Lake Park, and nearby Laurelwood Park to enjoy scenic trails and various outdoor activities. Belmont’s close-knit community is frequently brought together for a wide variety of special city events and programs as well.
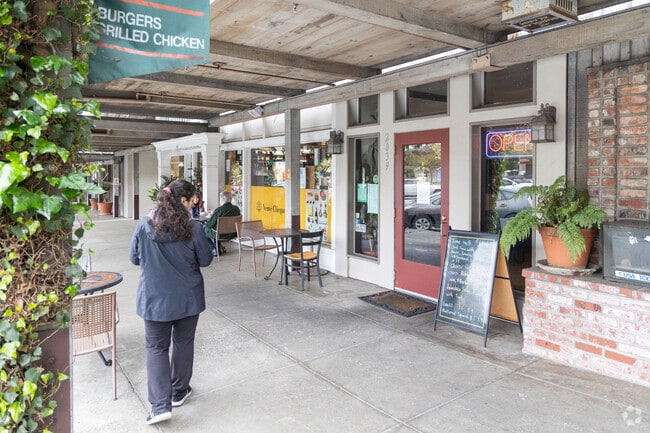
Belmont offers a host of diverse eateries and shops along its stretch of El Camino Real. Numerous metropolitan amenities are within close reach with quick access to the CalTrain and multiple major roadways.
Known for its wooded hills, views of the San Francisco Bay, and stretches of open space, Belmont is a quiet residential community in the midst of the culturally and technologically rich Bay Area.
Twin Pines Park is in the Carlmont neighborhood in Belmont, CA.
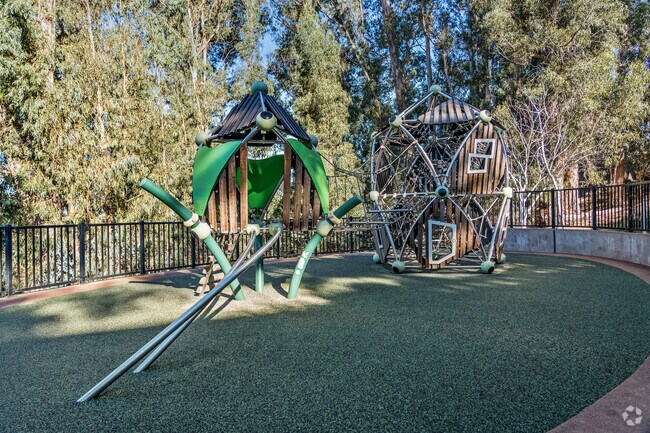
Your children can play on the structures at Davey Glen Park.
Belmont Country Club residents can check the daily menu at Cafe Bliss to see the new dishes.
Median Household Income
$183,212
Average: $193,377
Education
14,150
Residents Have a Degree
Job Market
14,641
Workers Employed
Median Age
43 Years
Largest Age Group
40-49 Years
Approximately 15% of Residents
Under 20
22%
Over 65
19%
Housing Distribution
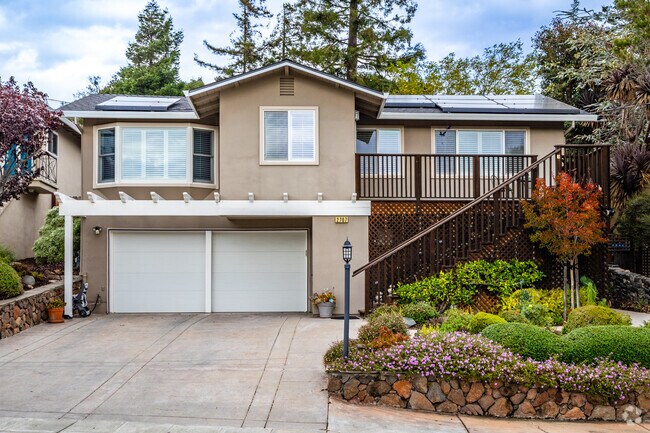
Belmont has more homeowners than renters.

Education Distribution
Review this city's overall education levels.

As of July 2026, the average apartment rent in Belmont, CA is $3,013 for a studio, $3,064 for one bedroom, $3,716 for two bedrooms, and $4,104 for three bedrooms. Apartment rent in Belmont has increased by 7.1% in the past year.
Explore how walkable, bikeable, drivable, and transit-friendly Belmont, CA is for everyday living.
Fairly Walkable
Walkability
Limited Public Transit
Transit
Very Drivable
Drivability
Fairly Bikeable
Bikeability
Public
Grades K-5
437 Students

Public
Grades K-5
437 Students
Public
Grades K-5
420 Students
Public
Grades K-5
471 Students

Public
Grades K-5
471 Students
Public
Grades 6-8
1,082 Students

Public
Grades K-8
566 Students

Public
Grades K-8
566 Students
Public
Grades 9-12
2,360 Students
Public
Grades 9-12
2,360 Students
† Our analysis of utilities, groceries, transportation, healthcare, home prices, and other goods and services is sourced from the Cost of Living Index, a respected benchmark published by the Council for Community and Economic Research (C2ER) that provides a thorough overview of living expenses across different regions.
Rent data is provided by CoStar Group’s Market Trend reports. As the industry leader in commercial real estate information, analytics, and news, CoStar conducts extensive research to produce and maintain a comprehensive database of commercial real estate information. We combine this data with public record to provide the most up-to-date rental information available.
Consumer goods, services, and home prices are sourced from the Cost of Living Index published by the Council for Community and Economic Research (C2ER). The data on this page is updated quarterly. It was last published in June 2026.
Demographic information comes from Neustar and combines detailed address data with U.S. Census and American Community Survey statistics to produce reliable local estimates.


