Median Age
44 Years
Largest Age Group
55-64 Years
Approximately 15% of Residents
Under 20
21%
Over 65
20%

Avg Rent
$2,319
Population
17,138
Renter Mix
18% Rent
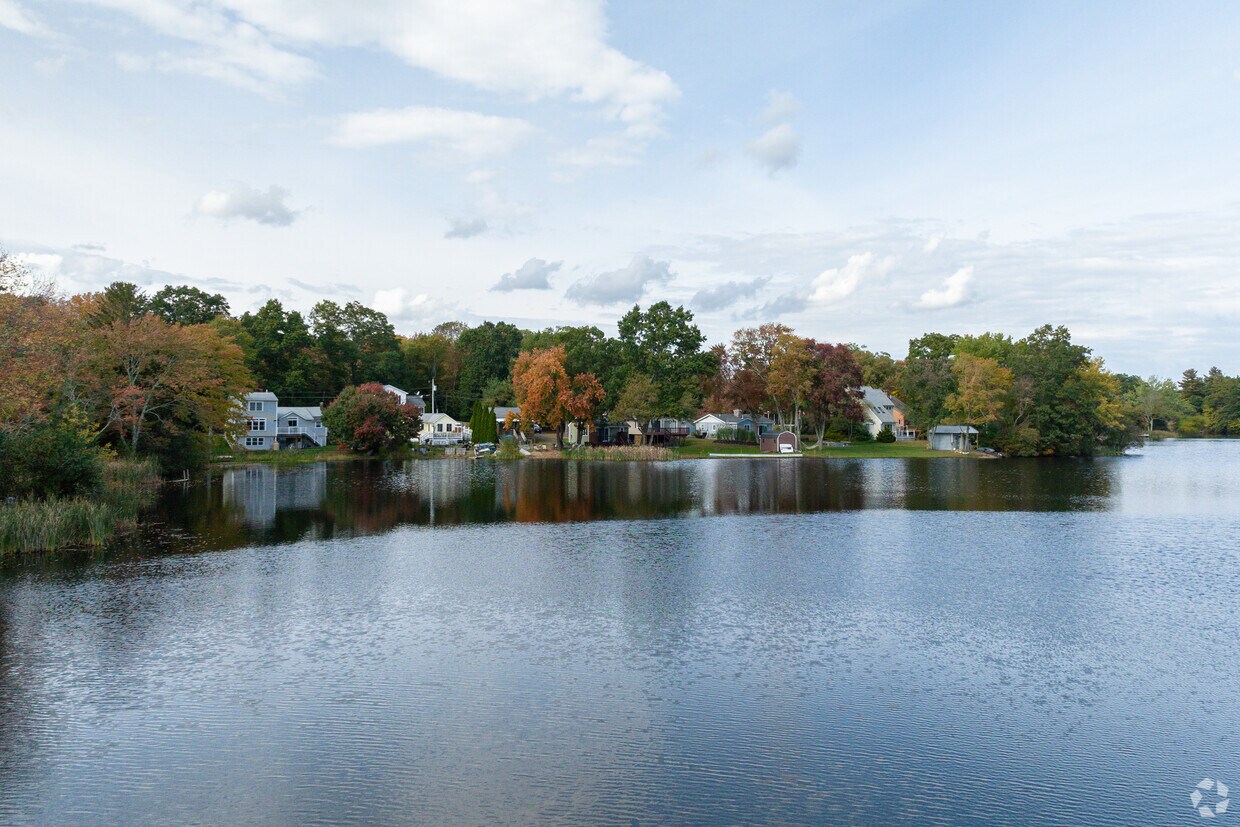
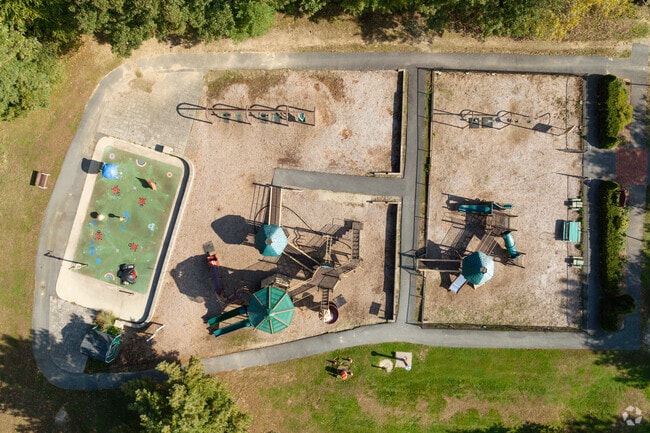
With an appealing mix of residential neighborhoods, local businesses, and sprawling wooded areas, Bellingham is a go-to destination for family-friendly living in southeastern Massachusetts. Residents adore the community parks, sports fields, and beautiful tree canopies in their home town, as well as the quaint local restaurants and shops.
Located 44 miles southwest of Boston, Bellingham is close enough to the city to access its plentiful amenities and attractions, while maintaining its suburban charm. Enjoy proximity to coastal views, the New England Aquarium, the Boston Logan International Airport, the Boston Tea Party Ships & Museum, and so much more.
Take part in this tight-knit community by bringing the whole family to popular campgrounds, or visit neighboring areas for access to golf courses, zoos, drive-in theaters, and more. Bellingham provides grocery stores, retailers, public schools, and everything you’d need to live your perfect suburban life. Luxury apartments and cozy condos are calling you to Massachusetts’ premier suburban oasis!
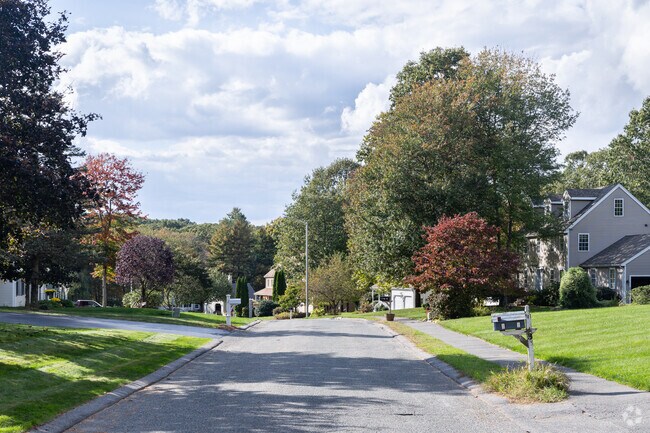
The picturesque winding streets of Bellingham make it a great place to call home.
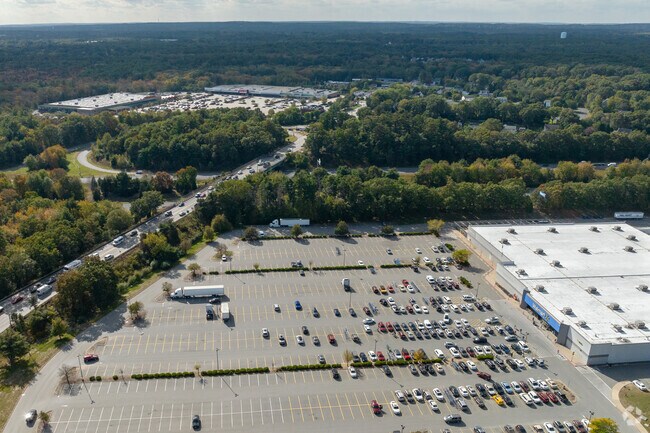
Stall Brook Plaza and Crossroads Shopping Center just across 495 in Bellingham.
Bellingham residents love to walk the Southern New England Trunkline Trail in all seasons.
Forge Park/Franklin Station is conveniently located for Bellingham residents.
Cape Cod-style homes line the streets of Bellingham.
Stop by The Beef Barn in Bellingham for fantastic food in a unique and charming atmosphere.
Median Household Income
$112,185
Average: $130,738
Education
5,877
Residents Have a Degree
Job Market
10,179
Workers Employed
Median Age
44 Years
Largest Age Group
55-64 Years
Approximately 15% of Residents
Under 20
21%
Over 65
20%
Housing Distribution
Bellingham has more homeowners than renters.

Education Distribution
Review this city's overall education levels.

As of July 2026, the average apartment rent in Bellingham, MA is $2,319 for one bedroom, $2,832 for two bedrooms, and $3,809 for three bedrooms. Apartment rent in Bellingham has increased by 2.2% in the past year.
Explore how walkable, bikeable, drivable, and transit-friendly Bellingham, MA is for everyday living.
Somewhat Walkable
Walkability
Exceptionally Drivable
Drivability
Somewhat Bikeable
Bikeability
Public
Grades PK-5
383 Students

Bellingham Memorial Middle School
Public
Grades K-8
578 Students

Public
Grades K-5
306 Students
Public
Grades K-4
233 Students
Bellingham Memorial Middle School
Public
Grades K-8
578 Students
Public
Grades 6-12
764 Students

Public
Grades 6-12
26 Students

Public
Grades 6-12
764 Students
Public
Grades 6-12
26 Students
† Our analysis of utilities, groceries, transportation, healthcare, home prices, and other goods and services is sourced from the Cost of Living Index, a respected benchmark published by the Council for Community and Economic Research (C2ER) that provides a thorough overview of living expenses across different regions.
Rent data is provided by CoStar Group’s Market Trend reports. As the industry leader in commercial real estate information, analytics, and news, CoStar conducts extensive research to produce and maintain a comprehensive database of commercial real estate information. We combine this data with public record to provide the most up-to-date rental information available.
Consumer goods, services, and home prices are sourced from the Cost of Living Index published by the Council for Community and Economic Research (C2ER). The data on this page is updated quarterly. It was last published in June 2026.
Demographic information comes from Neustar and combines detailed address data with U.S. Census and American Community Survey statistics to produce reliable local estimates.


