Median Age
35 Years
Largest Age Group
30-39 Years
Approximately 17% of Residents
Under 20
28%
Over 65
11%
Avg Rent
$1,207
Population
94,455
Renter Mix
44% Rent
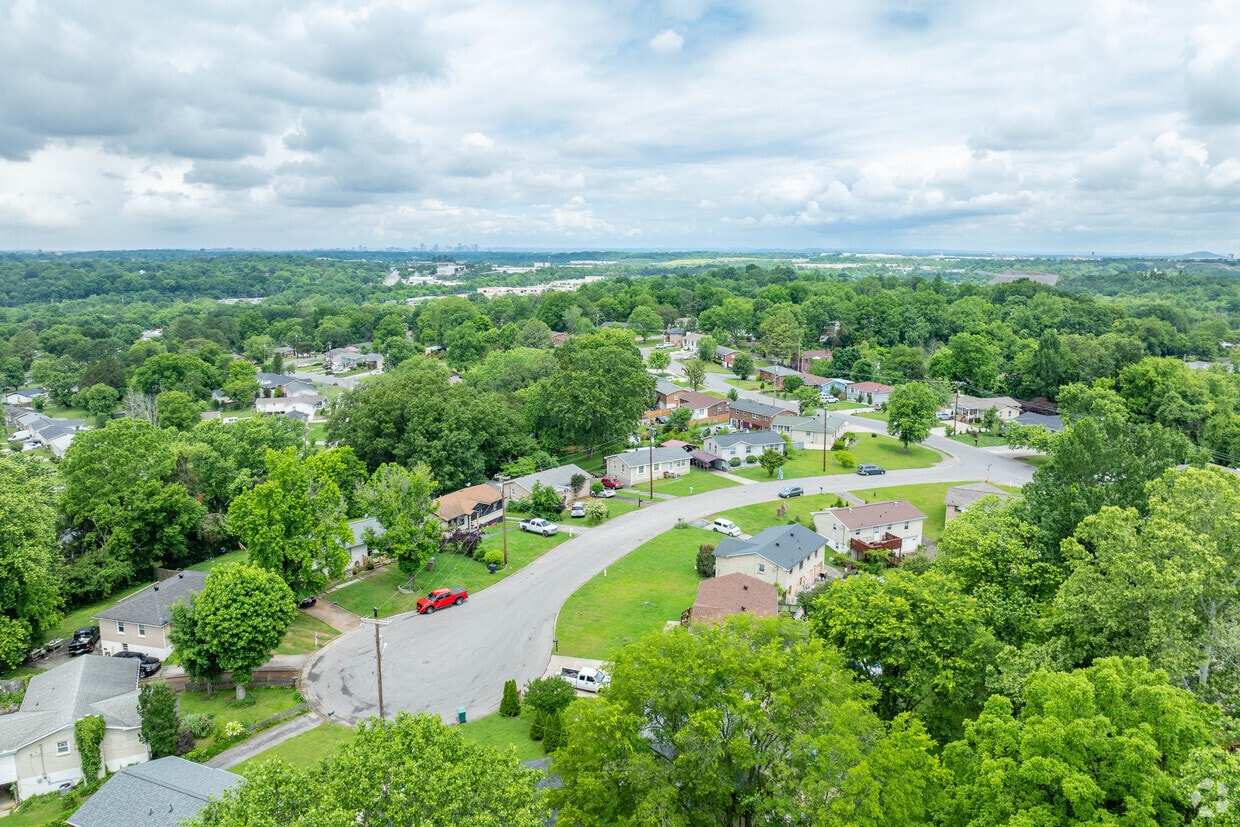
Don't let Antioch's laidback vibe feel fool you -- this picture-perfect city is increasing rapidly in popularity. With plenty of growth and new developments, many new residents are discovering Antioch's charms. When looking for apartments in Antioch, you'll find a variety of options, from modern communities to renovated historic properties.
Located next to Nashville, some of the history, culture, music, and food spills over into Antioch. And trips into Nashville -- to visit its iconic music halls, the Nashville Zoo, and more -- takes just minutes. Enjoy the mountainous landscape in the nearby parks, including Long Hunter State Park or Antioch Park. Golf lovers will appreciate Mike Wine Golf Academy, and those who enjoy nighttime entertainment will find their place at Bailey's Sports Bar and Grille.
The Hickory Hollow Mall has some of today's most well-known clothing apparel stores, including The Gap and New York & Co. The Global Mall at the Crossings offers delicious food, a dance studio, excellent electronic stores and lots more.
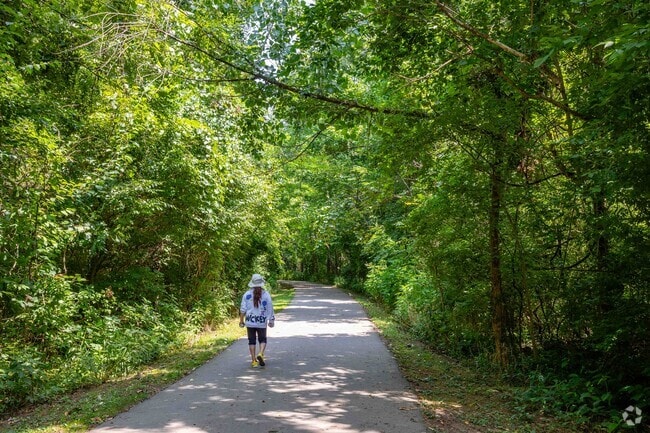
The Mill Creek Greenway is a great space for locals to enjoy nature.
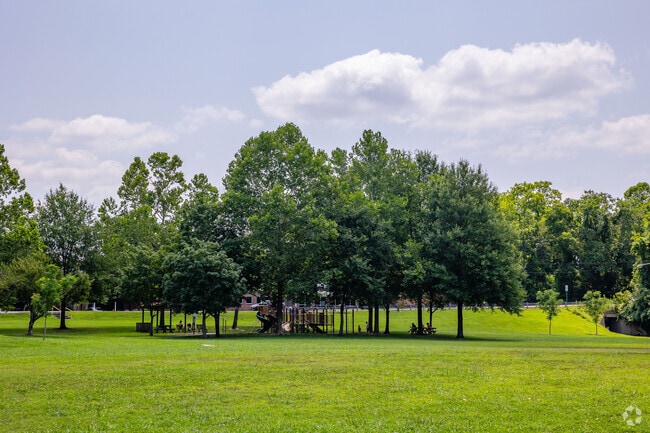
Antioch Park has a playground for kids to play and have fun.
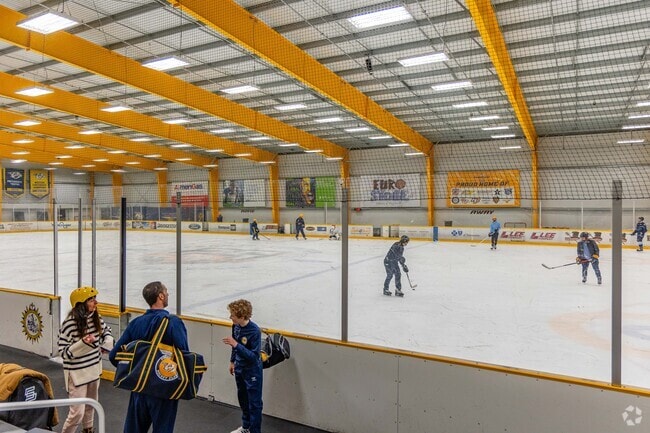
Family and friends have the 90,000SF Ford Ice Center in Antioch to play hockey.
The Mill Creek Greenway at Antioch Park has miles of walking trails for exercising.
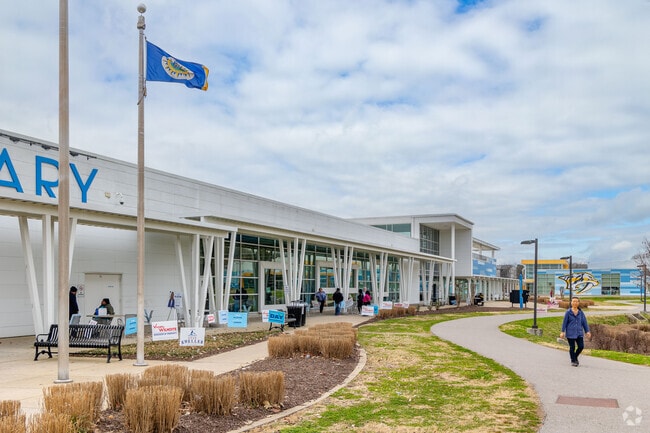
The Southeast Community Center is located in Antioch, 12 miles South of Downtown Nashville.
Townhome communities provide homeowners security with an HOA in Antioch.
Median Household Income
$65,722
Average: $82,722
Education
26,031
Residents Have a Degree
Job Market
53,415
Workers Employed
Median Age
35 Years
Largest Age Group
30-39 Years
Approximately 17% of Residents
Under 20
28%
Over 65
11%
Housing Distribution
Antioch has more homeowners than renters.

Education Distribution
Review this city's overall education levels.

As of July 2026, the average apartment rent in Antioch, TN is $1,189 for a studio, $1,205 for one bedroom, $1,501 for two bedrooms, and $1,950 for three bedrooms. Apartment rent in Antioch has increased by 0.2% in the past year.
Explore how walkable, bikeable, drivable, and transit-friendly Antioch, TN is for everyday living.
Fairly Walkable
Walkability
Exceptionally Drivable
Drivability
Fairly Bikeable
Bikeability
† Our analysis of utilities, groceries, transportation, healthcare, home prices, and other goods and services is sourced from the Cost of Living Index, a respected benchmark published by the Council for Community and Economic Research (C2ER) that provides a thorough overview of living expenses across different regions.
Rent data is provided by CoStar Group’s Market Trend reports. As the industry leader in commercial real estate information, analytics, and news, CoStar conducts extensive research to produce and maintain a comprehensive database of commercial real estate information. We combine this data with public record to provide the most up-to-date rental information available.
Consumer goods, services, and home prices are sourced from the Cost of Living Index published by the Council for Community and Economic Research (C2ER). The data on this page is updated quarterly. It was last published in June 2026.
Demographic information comes from Neustar and combines detailed address data with U.S. Census and American Community Survey statistics to produce reliable local estimates.


