
Beekman on Broadway
1100 Broadway St,
Ann Arbor, MI 48105
$1,950 - $3,975
Studio - 3 Beds


Ann Arbor, home to the University of Michigan, combines academic spirit with small-city appeal. With approximately 120,000 residents, the city maintains over 50,000 trees along its streets and in parks, earning its "Tree Town" nickname. The downtown area preserves its historic architecture while accommodating modern growth. Outdoor enthusiasts enjoy the Nichols Arboretum and the Border-to-Border Trail along the Huron River, perfect for kayaking, hiking, and cycling. The rental market reflects the city's desirability, with average rents ranging from $1,649 for studios to $3,733 for four-bedroom units, showing increases between 1.4% to 8.5% year-over-year across different unit sizes.
Each neighborhood offers its own character, from the preserved 19th-century homes in the Old West Side to the contemporary areas near Briarwood Mall. The South University and Kerrytown districts buzz with activity, while the Main Street area puts residents steps away from entertainment venues and dining options. The city hosts the Ann Arbor Art Fair, drawing hundreds of thousands of visitors each summer, and preserves cultural landmarks like the Michigan Theater, a 1928 movie palace featuring films and performances. The city's greenbelt program protects surrounding farmland, maintaining green space for future generations. The historic Kerrytown district houses the year-round farmers market, while the city's growing technology sector continues to expand employment opportunities.
The Ann Arbor Art Fair is among the largest in the nation
Fall color in Ann Arbor
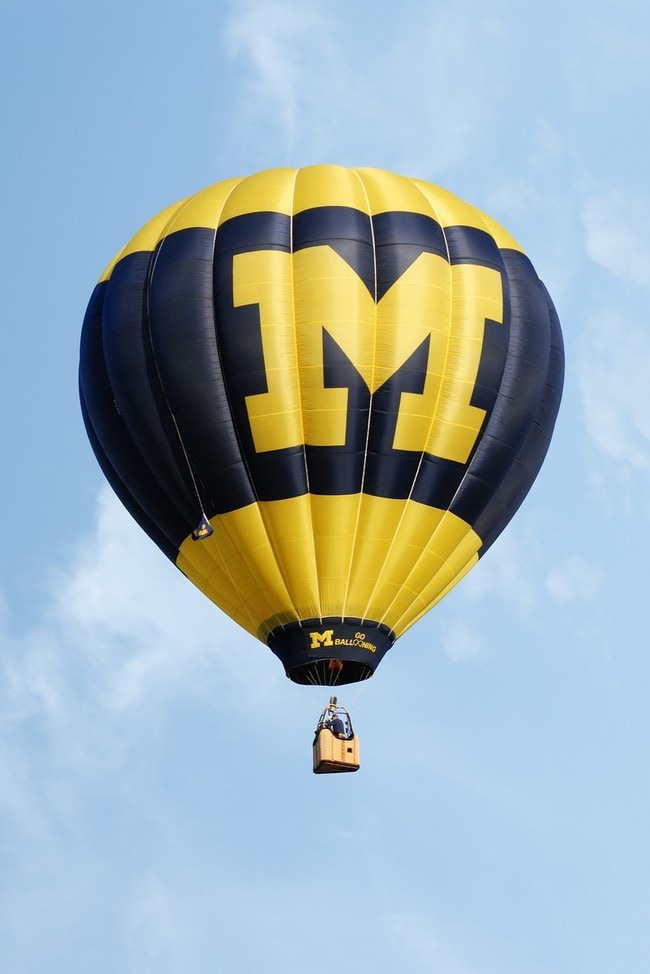
Hot air balloon over Ann Arbor
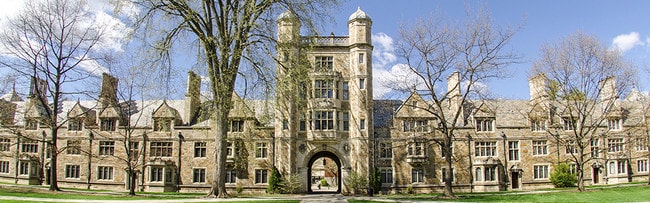
The University of Michigan library
As of March 2026, the average apartment rent in Ann Arbor, MI is $1,644 for a studio, $1,680 for one bedroom, $1,934 for two bedrooms, and $2,488 for three bedrooms. Apartment rent in Ann Arbor has decreased by -0.1% in the past year.
The cost of living in Ann Arbor, MI is 5.4% higher than the national average. Generally, housing in Ann Arbor is 16.8% more expensive than the national average, with rent falling between $1,644 - $2,488. You can expect to pay 10.0% more for groceries, 4.5% less for utilities, and 1.6% less for transportation.
Explore how walkable, bikeable, drivable, and transit-friendly Ann Arbor, MI is for everyday living.
Somewhat Walkable
You might be able to get out and walk when living in this area. Some errands can be accomplished on foot, but for others you’ll need a car.
Some Transit
You'll likely want a car when living in this area since it has few transit options.
Bikeable
While there’s some bike infrastructure in this area, you’ll still need a car for many errands.
Public
Grades K-8

Public
Grades K-5

Public
Grades K-5
Public
Grades K-5
Public
Grades K-5
Public
Grades K-8
Public
Grades 6-8

Public
Grades K-8
Public
Grades 6-8
Public
Grades 6-8
Public
Grades 9-12
Public
Grades 9-12
Public
Grades 9-12
Washtenaw Technical Middle College
Public
Grades 9-12
Public
Grades 9-12

11
Communities
96
Units
1
City

11
Communities
377
Units
3
Cities

11
Communities
798
Units
3
Cities

44
Communities
8,602
Units
27
Cities

165
Communities
33,531
Units
94
Cities

18
Communities
2,165
Units
9
Cities
† Our analysis of utilities, groceries, transportation, healthcare, home prices, and other goods and services is sourced from the Cost of Living Index, a respected benchmark published by the Council for Community and Economic Research (C2ER) that provides a thorough overview of living expenses across different regions.
Rent data is provided by CoStar Group’s Market Trend reports. As the industry leader in commercial real estate information, analytics, and news, CoStar conducts extensive research to produce and maintain a comprehensive database of commercial real estate information. We combine this data with public record to provide the most up-to-date rental information available.
Consumer goods, services, and home prices are sourced from the Cost of Living Index published by the Council for Community and Economic Research (C2ER). The data on this page is updated quarterly. It was last published in February 2026.


