
Alhambra Gardens
1221 S Atlantic Blvd,
Alhambra, CA 91803
$1,895 - $2,295
1-2 Beds
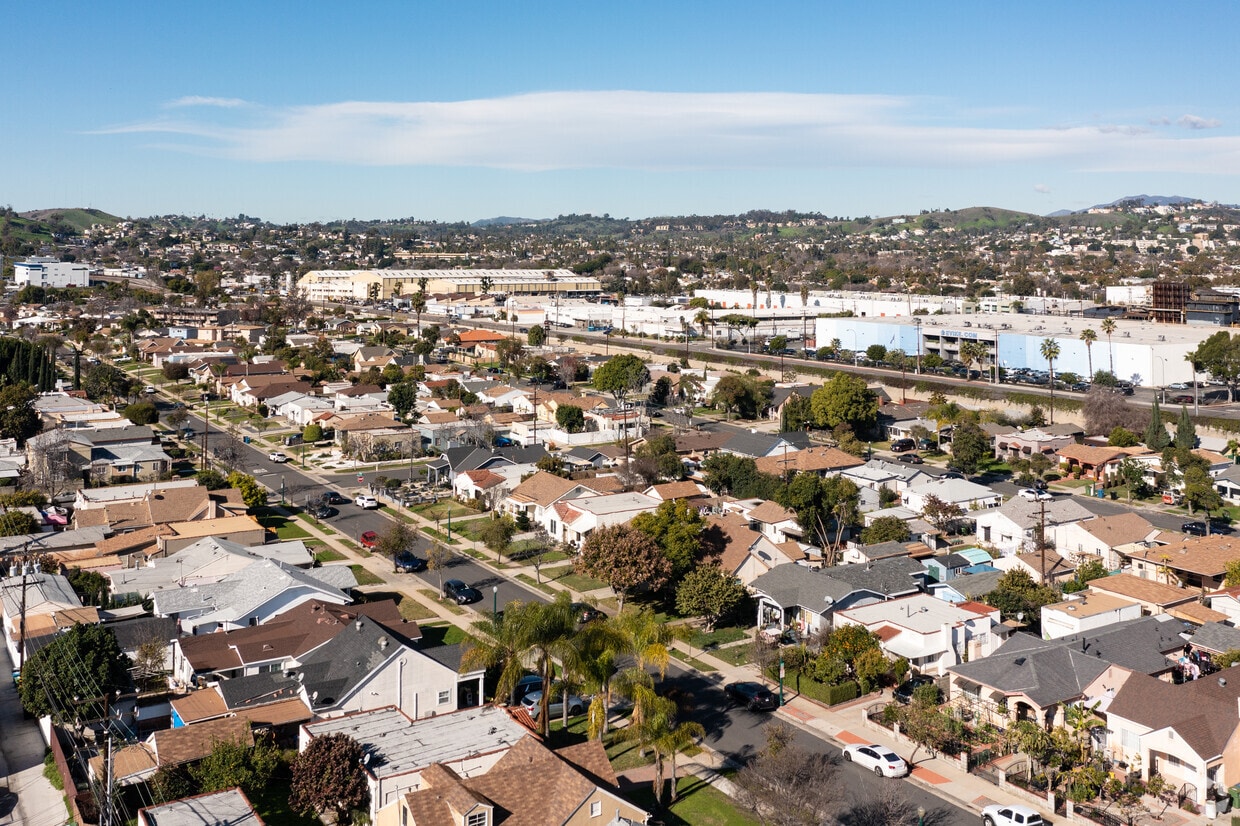


Located in the western San Gabriel Valley, Alhambra combines suburban comfort with city conveniences. This welcoming city features an array of housing options, from historic homes in the Bean Tract and Midwick Tract to contemporary apartment communities. The revitalized downtown area along Main Street offers shopping, dining, and entertainment. One-bedroom apartments in Alhambra average $1,577, while two-bedroom units average $1,989 per month.
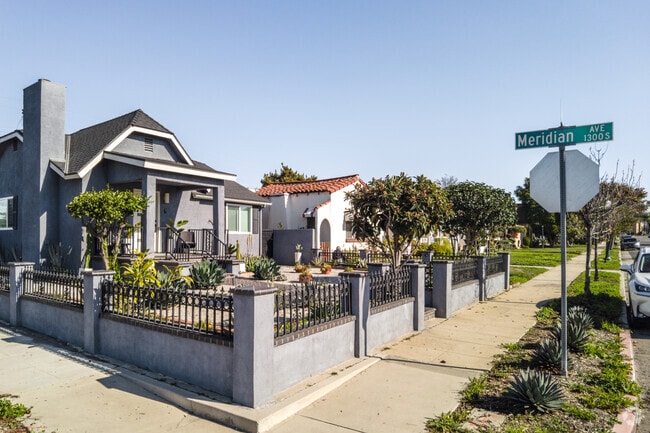
Architectural styles throughout Alhambra range from craftsman and Spanish Mediterranean to Italian beaux-arts designs. The city sits just eight miles from downtown Los Angeles, offering convenient access while maintaining tree-lined streets and neighborhood parks. Valley Boulevard features markets and restaurants that showcase the area's cultural heritage. History enthusiasts appreciate Alhambra's 26 designated historic districts, while longtime establishments like Fosselman's Ice Cream Company, serving homemade treats since 1919, and The Hat, known for its pastrami dips since 1951, remain neighborhood favorites. The city hosts community events throughout the year, including a popular Lunar New Year Festival that brings the community together.
Alhambra Arch resembles the Washington Square Arch in NYC.
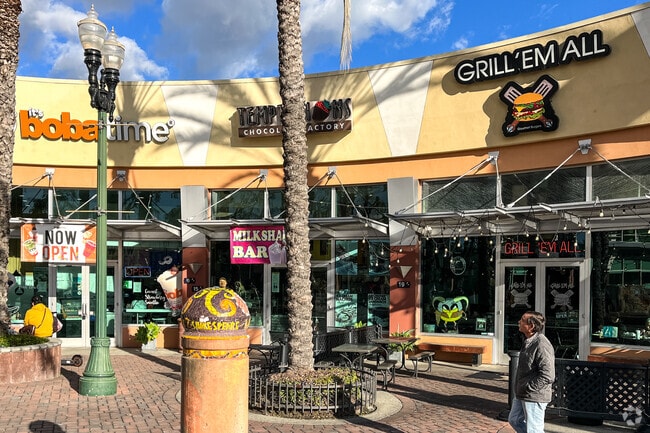
Dining & Drink.
Neon Border Monument, come again soon sign.
Streets of Alhambra are pets friendly.
At Alhambra park you can find a spacious playground.
Many FWY make commute to Alhambra very easy.
As of March 2026, the average apartment rent in Alhambra, CA is $1,487 for a studio, $1,652 for one bedroom, $1,989 for two bedrooms, and $2,238 for three bedrooms. Apartment rent in Alhambra has increased by 1.5% in the past year.
Explore how walkable, bikeable, drivable, and transit-friendly Alhambra, CA is for everyday living.
Very Walkable
If you enjoy walking, you’ll enjoy renting in this area! It’s a very walkable neighborhood.
Minimal Transit
You'll likely want a car when living in this area since it has few transit options.
Bikeable
While there’s some bike infrastructure in this area, you’ll still need a car for many errands.
Public
Grades K-8

Public
Grades K-8

Public
Grades K-8
Public
Grades K-8
Public
Grades K-8
Public
Grades K-8
Public
Grades K-8
Public
Grades K-8
Public
Grades K-8
Public
Grades K-8
Public
Grades 9-12

Public
Grades 9-12

15
Communities
394
Units
10
Cities

3,489
Communities
959,639
Units
894
Cities

553
Communities
123,847
Units
220
Cities

43
Communities
5,021
Units
31
Cities

28
Communities
10,918
Units
21
Cities

35
Communities
1,551
Units
8
Cities
† Our analysis of utilities, groceries, transportation, healthcare, home prices, and other goods and services is sourced from the Cost of Living Index, a respected benchmark published by the Council for Community and Economic Research (C2ER) that provides a thorough overview of living expenses across different regions.
Rent data is provided by CoStar Group’s Market Trend reports. As the industry leader in commercial real estate information, analytics, and news, CoStar conducts extensive research to produce and maintain a comprehensive database of commercial real estate information. We combine this data with public record to provide the most up-to-date rental information available.
Consumer goods, services, and home prices are sourced from the Cost of Living Index published by the Council for Community and Economic Research (C2ER). The data on this page is updated quarterly. It was last published in February 2026.


