Copa Ladeene
23920 Anza Ave,
Torrance, CA 90505
1-3 Beds | $2,380 - $3,999
Updated September 2026
Rent in Torrance is 26% higher than the national average rent of $1,665/month, making this one of the more expensive cities statewide.
$2,096/month
Average Rent
649 Sq Ft
Average Size
+1.5%
Change / Year
649
Available Apartments
Torrance rent varies by unit size and layout:
In the past year, rent has increased by 1.5%, which averages out to $31 more per month.
Market Trends Over Time
September 2026


Based on current rent prices, Harbor, Olde Torrance Neighborhood and Delthome are the most affordable neighborhoods in Torrance.
Based on current rent prices, Torrance Heights Civic, Marble Estates and Southwood are the most expensive neighborhoods in Torrance.
The neighborhoods in Torrance with the most apartments available are South Bay, Southwood Riviera and Southwood .
Because the average rent in Torrance is $2,096, you’ll want to make about $6,986 per month or $83,832 per year. The general guideline is to pay no more than 30 percent of your monthly income on rent. However, you’ll want to consider additional factors, such as your monthly bills and other expenses. Use our rent affordability calculator to help determine how much to budget for rent.
Use the tool below to compare Torrance, CA to other nearby cities and neighborhoods. The Apartments.com neighborhood guides provide you with insight into the area’s transportation, things to do, and more.
View the Torrance Area GuideGet a clearer picture of the area by viewing rent trends in nearby cities.
Redondo Beach
Avg Rent: $2,606/month

Hermosa Beach
Avg Rent: $3,008/month

Lomita
Avg Rent: $2,135/month
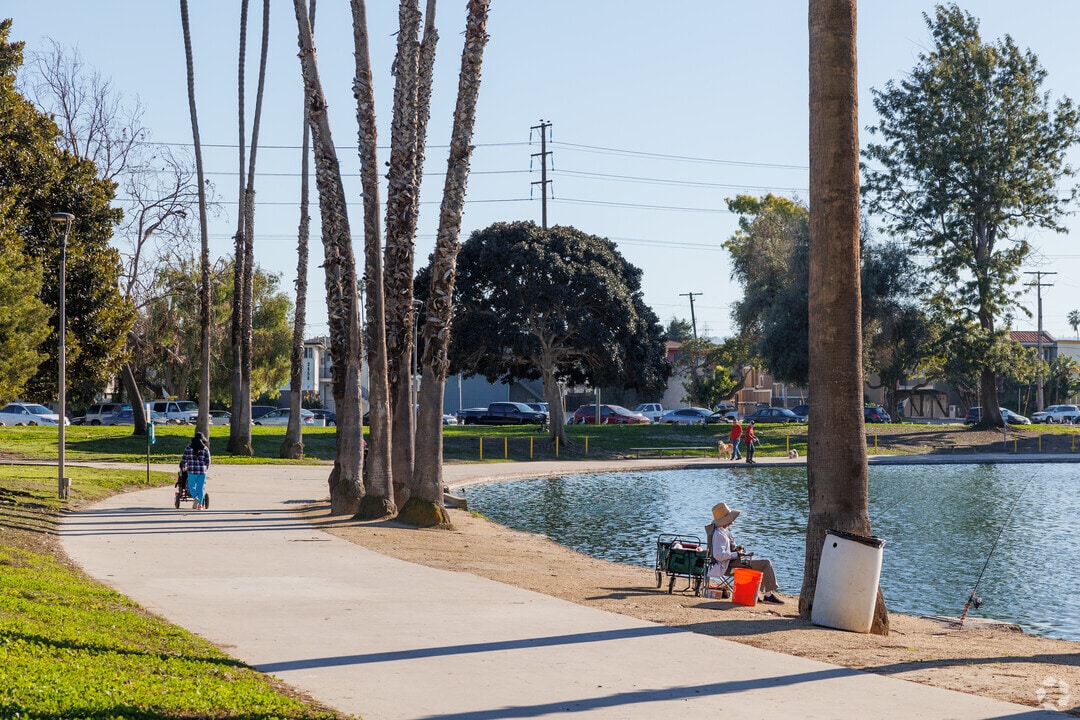
Lawndale
Avg Rent: $1,766/month
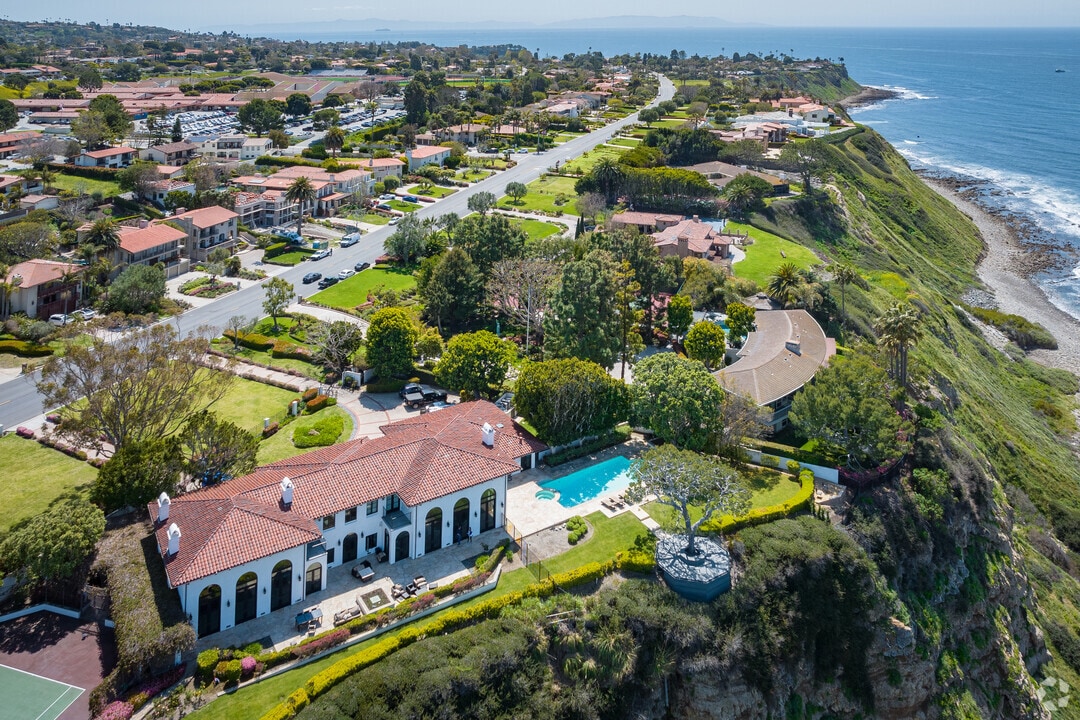
Palos Verdes Estates
Avg Rent: $2,878/month
Our all-in-one suite of property manangement software makes the rental process easy. Screen tenants, manage payments, and more – all on Apartments.com
The average rent in Torrance is $2,096 per month, which is 25.9% higher than the national average of $1,665.
The average rent for a house in Torrance, CA is $5,440 per month.
The average rent for a townhome in Torrance, CA is $3,851 per month.
The average rent for a condo in Torrance, CA is $2,791 per month.
Rents in Torrance, CA are increasing, with prices up 1.5% year-over-year and $31 more per month.
In Torrance, CA, 57% of apartments fall above $2,000/month, though prices may vary depending on location and other factors.
† Our analysis of utilities, groceries, transportation, healthcare, home prices, and other goods and services is sourced from the Cost of Living Index, a respected benchmark published by the Council for Community and Economic Research (C2ER) that provides a thorough overview of living expenses across different regions.
Rent data is provided by CoStar Group’s Market Trend reports. As the industry leader in commercial real estate information, analytics, and news, CoStar conducts extensive research to produce and maintain a comprehensive database of commercial real estate information. We combine this data with public record to provide the most up-to-date rental information available.
Consumer goods, services, and home prices are sourced from the Cost of Living Index published by the Council for Community and Economic Research (C2ER). The data on this page is updated quarterly. It was last published in September 2026.
Demographic information comes from Neustar and combines detailed address data with U.S. Census and American Community Survey statistics to produce reliable local estimates.
* Percentages may not total 100 due to rounding.