Central Park West Apartments & Townhomes
4661-B New Hampshire Ct,
Youngstown, OH 44515
$705 - $1,350
Studio - 3 Beds


Living in Youngstown, Ohio combines affordability with a rich industrial heritage. Current rental trends show average apartment rates ranging from $592 for studios to $1,069 for three-bedroom units, with modest annual increases between 2-10% across different unit sizes. The city's housing market remains one of the most affordable in Ohio, with one-bedroom apartments averaging $702 per month, significantly below the state median.
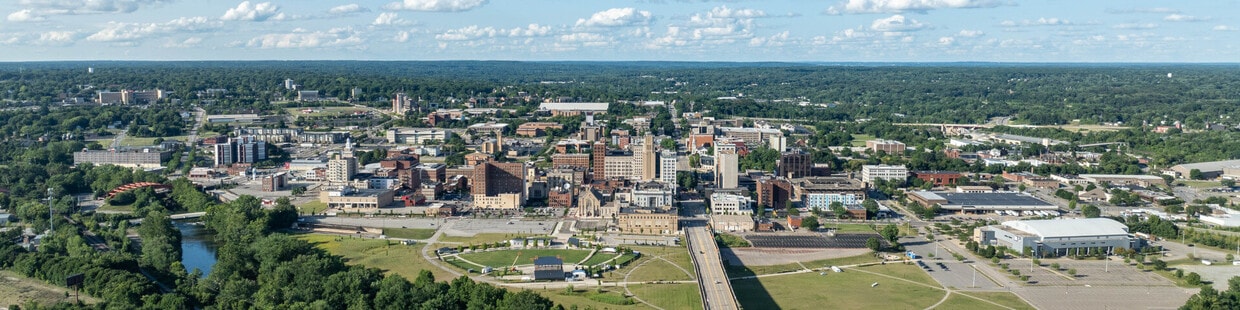
Youngstown's neighborhoods each have their own character, from the architecturally significant Crandall Park-Fifth Avenue Historic District to the residential areas surrounding the city center. Mill Creek Park, spanning 2,600 acres, offers residents hiking trails, gardens, and the preserved Lanterman's Mill. Downtown continues to grow with the Covelli Centre and Youngstown Foundation Amphitheatre hosting concerts and events throughout the year. The area near Youngstown State University features coffee shops, bookstores, and casual dining spots. The Butler Institute of American Art anchors the cultural district, while the Youngstown Historical Center of Industry and Labor preserves the city's manufacturing legacy. The downtown area has evolved to include the Youngstown Business Incubator, supporting new businesses and technology companies.
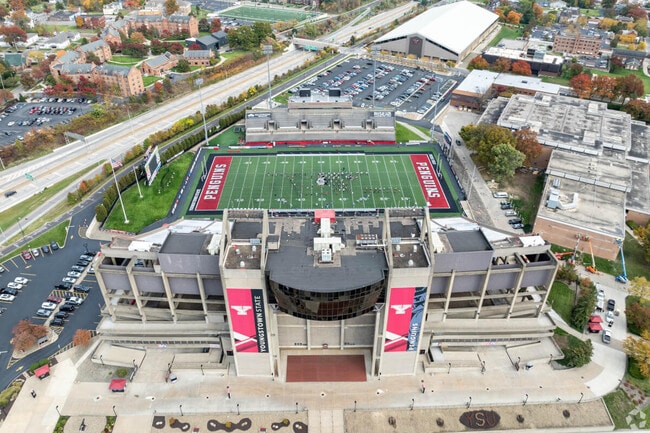
The Youngstown State Penguins football team plays at Stambaugh Stadium in Youngstown, Ohio.
The Butler Institute of American Art in Youngstown, Ohio, features works by American artists.
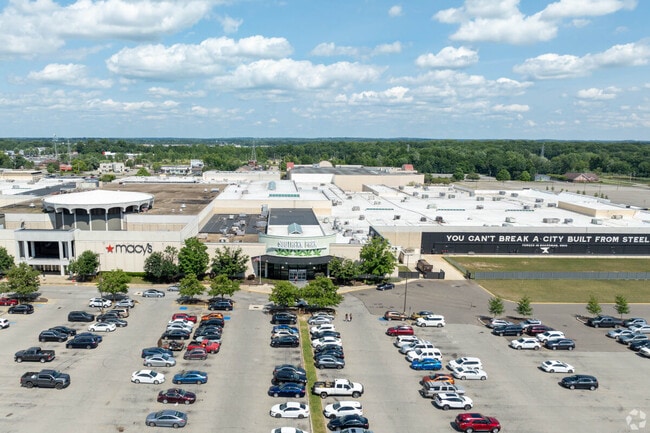
Youngstown residents shop at the Southern Park Mall in Boardman.
As of March 2026, the average apartment rent in Youngstown, OH is $603 for a studio, $705 for one bedroom, $897 for two bedrooms, and $1,237 for three bedrooms. Apartment rent in Youngstown has increased by 0.1% in the past year.
The cost of living in Youngstown, OH is 8.8% lower than the national average. Generally, housing in Youngstown is 16.5% less expensive than the national average, with rent falling between $603 - $1,237. You can expect to pay 2.0% less for groceries, 8.9% less for utilities, and 0.1% less for transportation.
Explore how walkable, bikeable, drivable, and transit-friendly Youngstown, OH is for everyday living.
Car-Dependent
This area is considered a car-dependent area and most errands will require a car.
Somewhat Bikeable
You might be able to find places to ride your bike in this area, but you’ll most likely want your car for most errands.
West Boulevard Elementary School
Public
Grades K-5

Stadium Drive Elementary School
Public
Grades K-5

Austintown Intermediate School
Public
Grades K-5

Public
Grades K-5

Robinwood Lane Elementary School
Public
Grades K-5
Boardman Glenwood Middle School
Public
Grades 6-8
Public
Grades 6-8
Public
Grades K-8

Public
Grades K-8
Horizon Science Academy Youngstown
Public
Grades K-8
Public
Grades 9-12
Public
Grades 9-12
Public
Grades 9-12
Public
Grades 6-12
Public
Grades 9-12

† Our analysis of utilities, groceries, transportation, healthcare, home prices, and other goods and services is sourced from the Cost of Living Index, a respected benchmark published by the Council for Community and Economic Research (C2ER) that provides a thorough overview of living expenses across different regions.
Rent data is provided by CoStar Group’s Market Trend reports. As the industry leader in commercial real estate information, analytics, and news, CoStar conducts extensive research to produce and maintain a comprehensive database of commercial real estate information. We combine this data with public record to provide the most up-to-date rental information available.
Consumer goods, services, and home prices are sourced from the Cost of Living Index published by the Council for Community and Economic Research (C2ER). The data on this page is updated quarterly. It was last published in February 2026.