Median Age
41 Years
Largest Age Group
35-44 Years
Approximately 14% of Residents
Under 20
23%
Over 65
20%
Avg Rent
$2,074
Population
14,618
Renter Mix
22% Rent
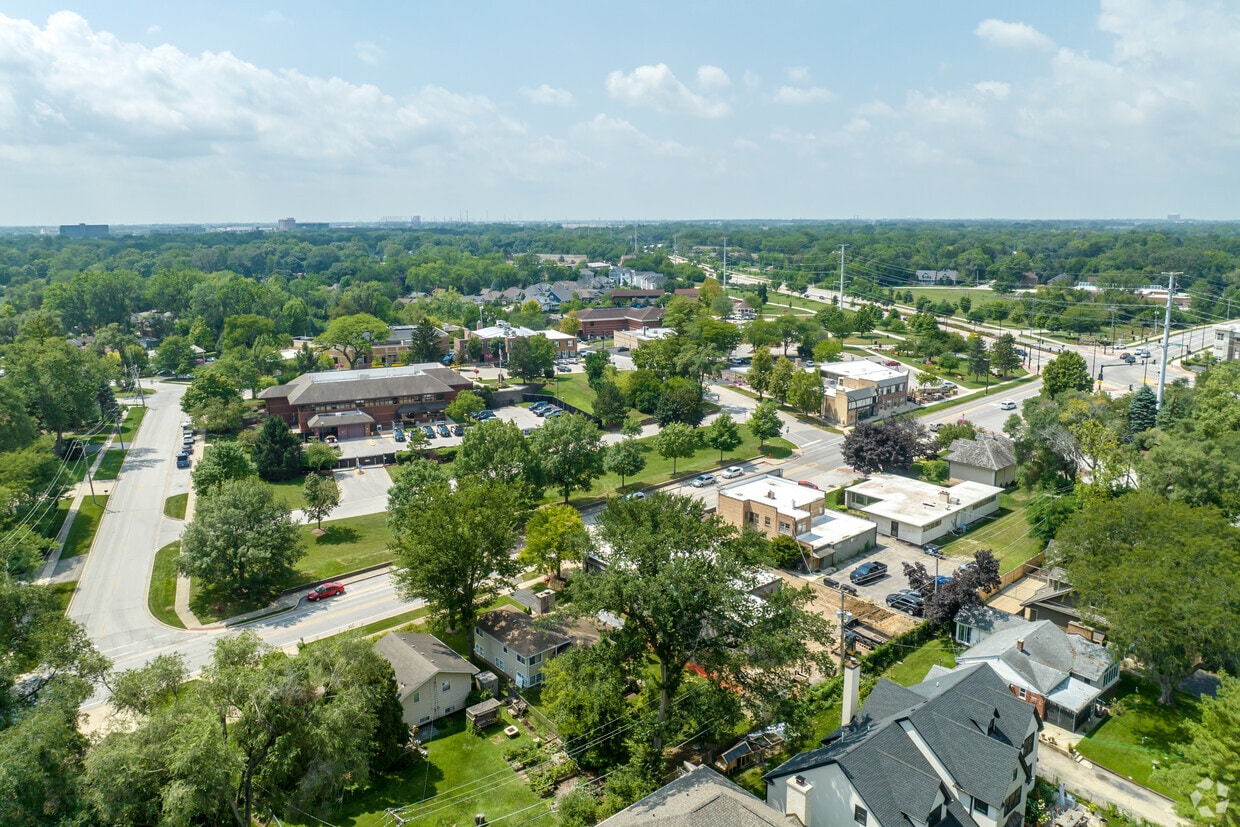
Located about 30 miles west of Chicago in DuPage County, Warrenville is a peaceful suburb with a small-town feel in the center of the nationally recognized I-88 research and development corridor. Natural beauty surrounds Warrenville, contributing to its serene atmosphere. Warrenville residents enjoy easy access to numerous parks, forest preserves, trails, and the West Branch of the DuPage River.
A variety of special events brings the community together in Warrenville, including the annual Independence Day Celebration, Summer Daze, Art on the Prairie, and Holly Days. Locals also delight in Warrenville’s top-notch school district, public art installations, and productions hosted by the Acorn Community Theatre. Attractions like the Morton Arboretum, Naper Settlement, and Chicago Premium Outlets are just minutes away from Warrenville.
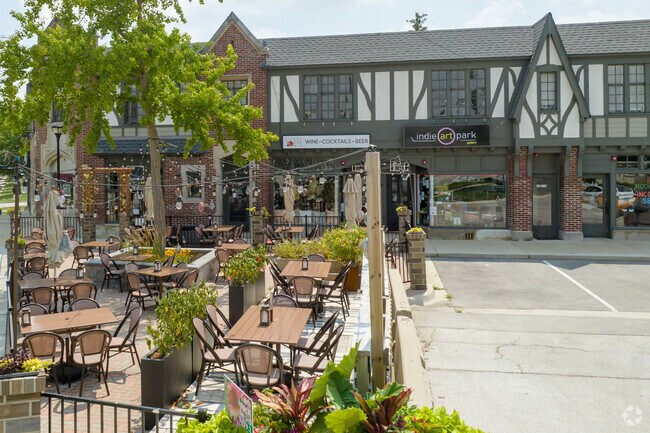
Warrenville has beautiful restaurants that offer outdoor dining.
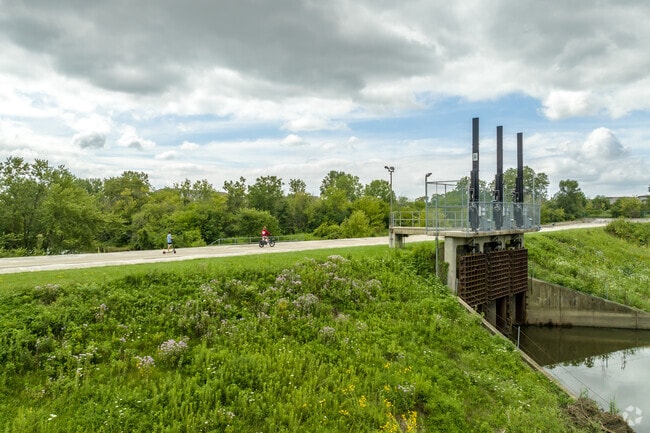
The Fawell Dam is located in the McDowell Grove Forest Preserve in Warrenville.
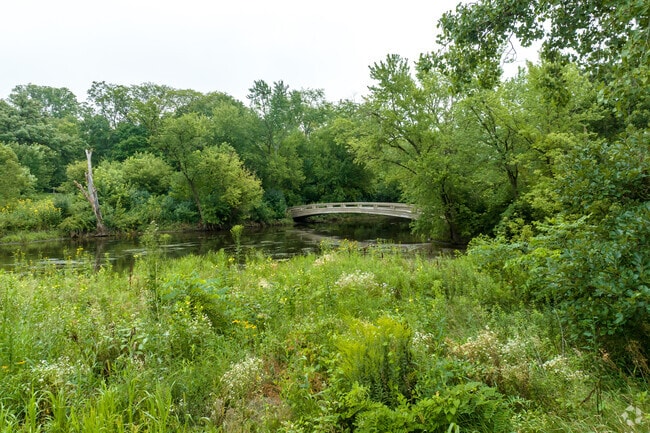
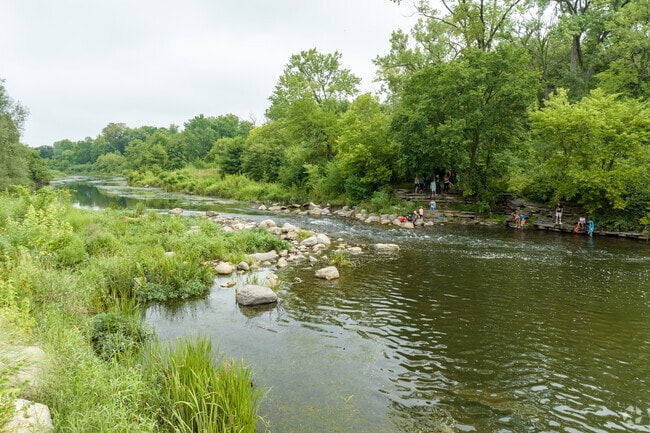
Residents take advantage of the plentiful waterways in Warrenville.
A couple with their dogs enjoying a walk at the McDowell Grove Forest Preserve in Warrenville.
There are many housing options in Warrenville.
A resident of Warrenville taking a walk with their elegant-looking dog towards a bike store.
Median Household Income
$98,162
Average: $117,139
Education
5,444
Residents Have a Degree
Job Market
8,453
Workers Employed
Median Age
41 Years
Largest Age Group
35-44 Years
Approximately 14% of Residents
Under 20
23%
Over 65
20%
Housing Distribution
Warrenville has more homeowners than renters.

Education Distribution
Review this city's overall education levels.

As of July 2026, the average apartment rent in Warrenville, IL is $1,677 for a studio, $2,072 for one bedroom, $2,436 for two bedrooms, and $3,307 for three bedrooms. Apartment rent in Warrenville has increased by 4.1% in the past year.
Explore how walkable, bikeable, drivable, and transit-friendly Warrenville, IL is for everyday living.
Somewhat Walkable
Walkability
Exceptionally Drivable
Drivability
Very Bikeable
Bikeability
Public
Grades K-5
423 Students

Public
Grades K-5
458 Students

Public
Grades 6-8
684 Students

† Our analysis of utilities, groceries, transportation, healthcare, home prices, and other goods and services is sourced from the Cost of Living Index, a respected benchmark published by the Council for Community and Economic Research (C2ER) that provides a thorough overview of living expenses across different regions.
Rent data is provided by CoStar Group’s Market Trend reports. As the industry leader in commercial real estate information, analytics, and news, CoStar conducts extensive research to produce and maintain a comprehensive database of commercial real estate information. We combine this data with public record to provide the most up-to-date rental information available.
Consumer goods, services, and home prices are sourced from the Cost of Living Index published by the Council for Community and Economic Research (C2ER). The data on this page is updated quarterly. It was last published in June 2026.
Demographic information comes from Neustar and combines detailed address data with U.S. Census and American Community Survey statistics to produce reliable local estimates.


