Median Age
42 Years
Largest Age Group
55-64 Years
Approximately 14% of Residents
Under 20
23%
Over 65
20%
Avg Rent
$1,188
Population
10,880
Renter Mix
33% Rent
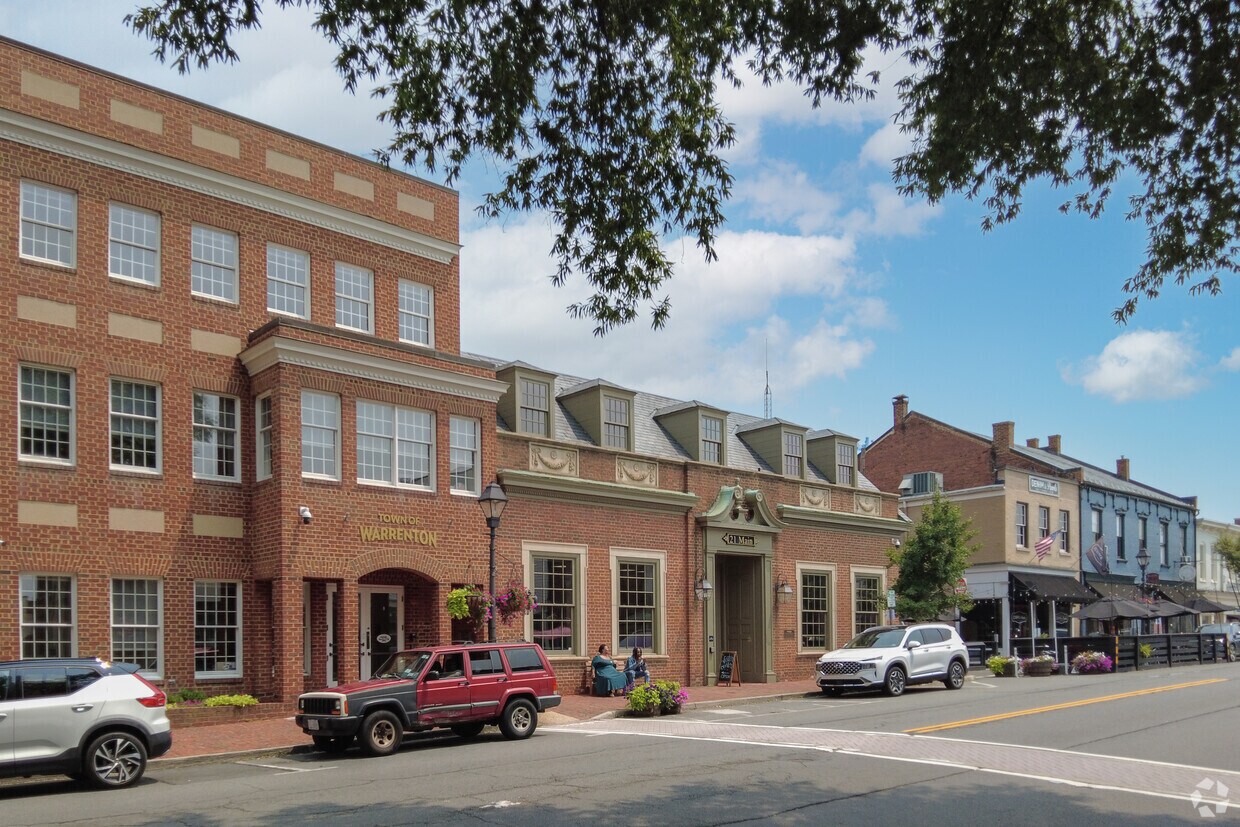
Warrenton sits at the heart of Fauquier County as its county seat, carrying the kind of small-town character that Northern Virginia's faster-growing suburbs have largely traded away. Incorporated in 1810 and named for Revolutionary War hero General Joseph Warren, the town has deep historical roots that show up in its brick storefronts, preserved courthouse district, and tree-lined streets. At just five square miles, it is compact enough to feel genuinely walkable, yet well-connected to the broader D.C. metro corridor via Route 29 and Interstate 66.
Neighborhoods here range from established in-town streets close to the Old Town core to newer residential pockets on the town's edges, offering a mix of architectural styles that spans colonial-influenced homes to contemporary builds. Renters can find everything from traditional townhomes and garden-style apartment communities to newer low-rise communities that blend into the surrounding landscape.
The local economy leans on government, healthcare, and professional services, with larger employment centers in Gainesville and Manassas just a short drive away. Lord Fairfax Community College serves the region, keeping an educational anchor close. Each fall, Warrenton hosts its long-running Warrenton Horse Show, one of the oldest outdoor horse shows on the East Coast, a tradition that reflects the town's proud equestrian heritage throughout Piedmont Virginia.
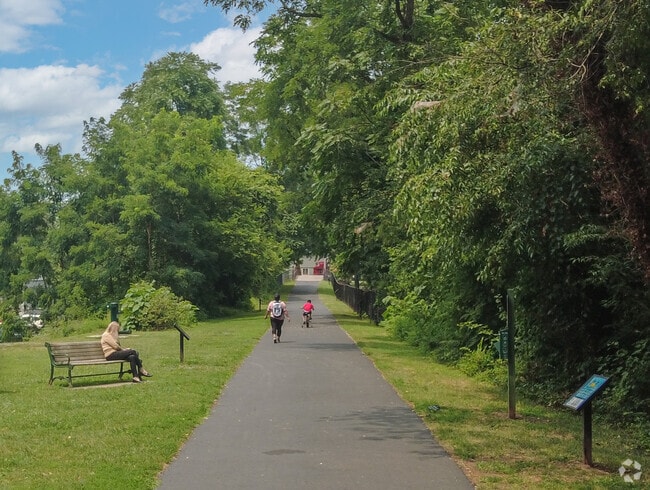
Enjoy a nice walk or relax on a bench at Warrenton Branch Greenway in Warrenton neighborhood.
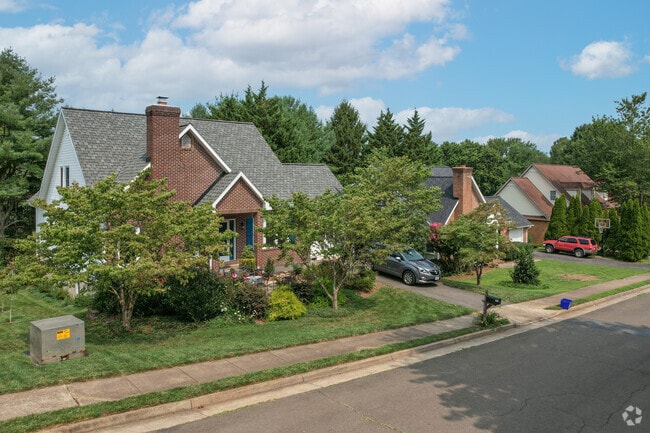
Inviting historic colonial homes can be found in the Warrenton area.
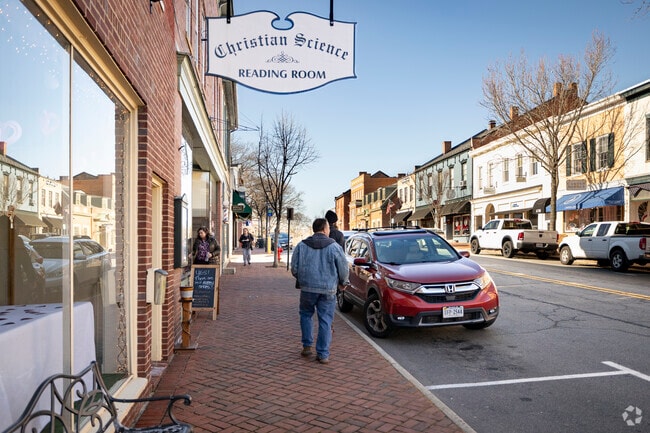
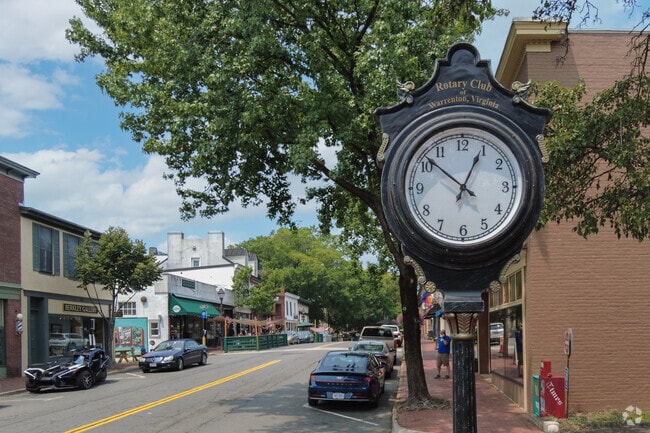
Warrenton is known for its historic downtown and the unique shopping experience.
Enjoy a meal on the patio at Claire's at the Depot in Warrenton.
Talk a stroll across the bridge at Warrenton Branch Greenway in Warrenton neighborhood.
New developments in Warrenton are attractive to families looking for low-maintenance homes.
Median Household Income
$88,116
Average: $111,531
Education
3,718
Residents Have a Degree
Job Market
5,704
Workers Employed
Median Age
42 Years
Largest Age Group
55-64 Years
Approximately 14% of Residents
Under 20
23%
Over 65
20%
Housing Distribution
Warrenton has more homeowners than renters.

Education Distribution
Review this city's overall education levels.

As of July 2026, the average apartment rent in Warrenton, VA is $1,188 for one bedroom, $1,378 for two bedrooms, and $1,306 for three bedrooms. Apartment rent in Warrenton has increased by 1.0% in the past year.
Explore how walkable, bikeable, drivable, and transit-friendly Warrenton, VA is for everyday living.
Fairly Walkable
Walkability
Limited Public Transit
Transit
Moderately Drivable
Drivability
Fairly Bikeable
Bikeability
Public
Grades PK-5
440 Students

Public
Grades PK-5
421 Students

Public
Grades PK-5
496 Students

James G. Brumfield Elementary School
Public
Grades PK-5
496 Students
Public
Grades PK-5
365 Students
Public
Grades 6-8
554 Students

Public
Grades 6-8
554 Students
Public
Grades 6-8
437 Students
Public
Grades 6-8
437 Students
Public
Grades 6-8
395 Students

Public
Grades 9-12
1,162 Students

Public
Grades 9-12
1,162 Students
† Our analysis of utilities, groceries, transportation, healthcare, home prices, and other goods and services is sourced from the Cost of Living Index, a respected benchmark published by the Council for Community and Economic Research (C2ER) that provides a thorough overview of living expenses across different regions.
Rent data is provided by CoStar Group’s Market Trend reports. As the industry leader in commercial real estate information, analytics, and news, CoStar conducts extensive research to produce and maintain a comprehensive database of commercial real estate information. We combine this data with public record to provide the most up-to-date rental information available.
Consumer goods, services, and home prices are sourced from the Cost of Living Index published by the Council for Community and Economic Research (C2ER). The data on this page is updated quarterly. It was last published in June 2026.
Demographic information comes from Neustar and combines detailed address data with U.S. Census and American Community Survey statistics to produce reliable local estimates.


