
West Park Manor
1756 Raleigh Ct E,
Ocean, NJ 07712
$1,999 - $2,499
1-2 Beds

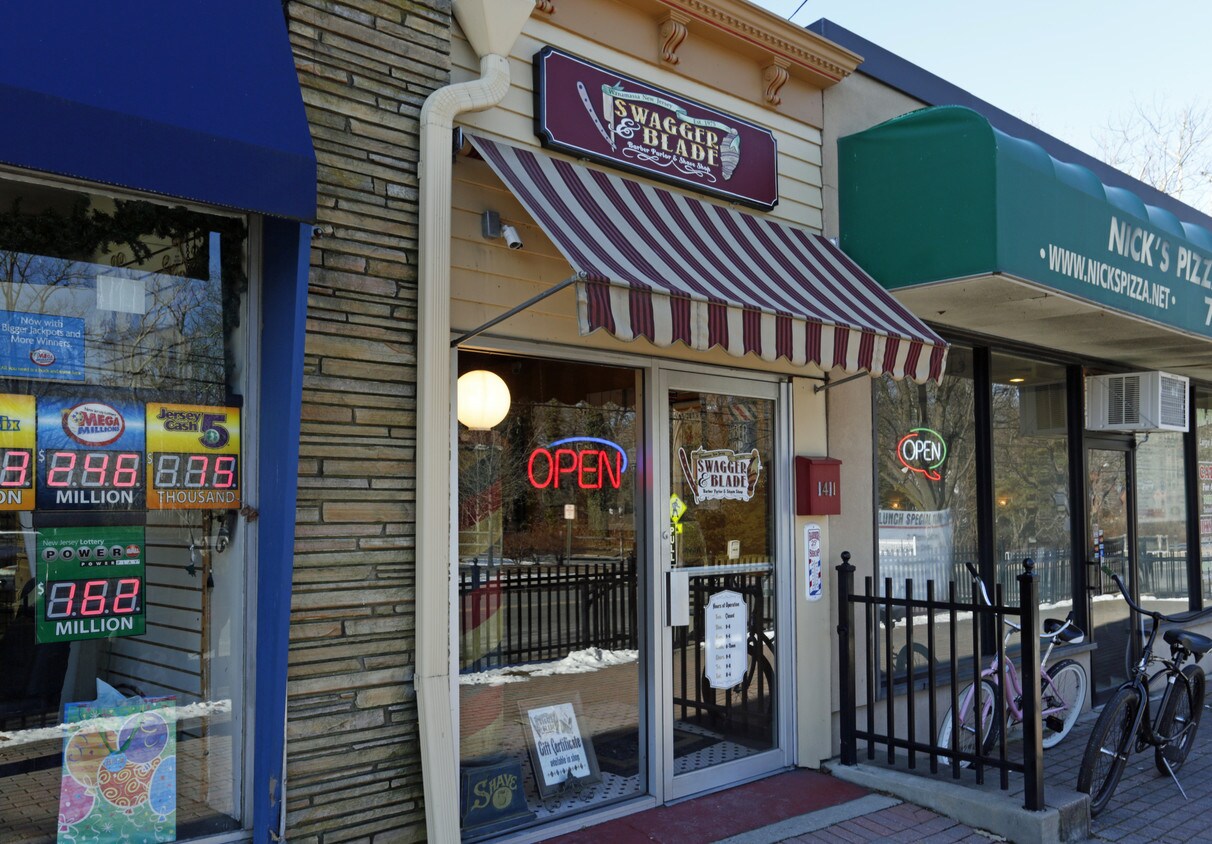
Wanamassa is a bustling community in the Ocean Township located a bit west of the Jersey Shore. This convenient neighborhood is equipped with easy access to nearby beaches, parks, amenities, and a sprawling golf course. Shopping plazas, stand-alone businesses, and service shops make up the space between Highway 18 and 35, while pizzerias and Italian restaurants can be found scattered inside and outside of town. Residents can travel a few minutes outside of Wanamassa to access popular Jersey Beaches like Asbury Park Beach and Ocean Grove Beach, or spend a day at Joe Palaia Park Addition, a park situated on the northeastern border of Wanamassa. Apartments ranging from affordable to upscale and colonial-style homes on the far eastern side of the neighborhood make up the rental market.
As of March 2026, the average apartment rent in Wanamassa is $1,622 for one bedroom, $2,266 for two bedrooms, and $3,382 for three bedrooms. Apartment rent in Wanamassa has decreased by -3.2% in the past year.
1 BR
791 sq ft
Average Sq Ft
$1,622/month
Average Rent
2 BR
1,027 sq ft
Average Sq Ft
$2,266/month
Average Rent
3 BR
1,166 sq ft
Average Sq Ft
$3,382/month
Average Rent
Explore how walkable, bikeable, drivable, and transit-friendly Wanamassa - Ocean, NJ is for everyday living.
Somewhat Walkable
You might be able to get out and walk when living in this area. Some errands can be accomplished on foot, but for others you’ll need a car.
Somewhat Bikeable
You might be able to find places to ride your bike in this area, but you’ll most likely want your car for most errands.
Niche User
11 years and 7 months ago•Niche Review
In this area there is discrete discrimination.
Niche User
11 years and 8 months ago•Niche Review
not many mom and pop stores, and limited chain stores
Niche User
11 years and 8 months ago•Niche Review
Most houses are well maintained

3,489
Communities
958,056
Units
893
Cities

715
Communities
198,531
Units
338
Cities

631
Communities
175,806
Units
251
Cities

625
Communities
125,220
Units
245
Cities

566
Communities
126,998
Units
222
Cities

458
Communities
108,651
Units
228
Cities
† Our analysis of utilities, groceries, transportation, healthcare, home prices, and other goods and services is sourced from the Cost of Living Index, a respected benchmark published by the Council for Community and Economic Research (C2ER) that provides a thorough overview of living expenses across different regions.
Rent data is provided by CoStar Group’s Market Trend reports. As the industry leader in commercial real estate information, analytics, and news, CoStar conducts extensive research to produce and maintain a comprehensive database of commercial real estate information. We combine this data with public record to provide the most up-to-date rental information available.
Consumer goods, services, and home prices are sourced from the Cost of Living Index published by the Council for Community and Economic Research (C2ER). The data on this page is updated quarterly. It was last published in February 2026.


")


