
Virtu on Bagby Ave
6901 Bagby Ave,
Waco, TX 76712
$1,200 - $1,895
1-3 Beds


Living in Waco, Texas combines small-city comfort with metropolitan conveniences in Central Texas. Home to approximately 144,000 residents and Baylor University, the city maintains a welcoming atmosphere enriched by its academic presence. The rental market shows one-bedroom apartments averaging $1,030 monthly and two-bedroom units at $1,253. Notable areas include the tree-lined streets of Castle Heights, the walkable neighborhoods surrounding Baylor University, and the residential communities of Woodway.
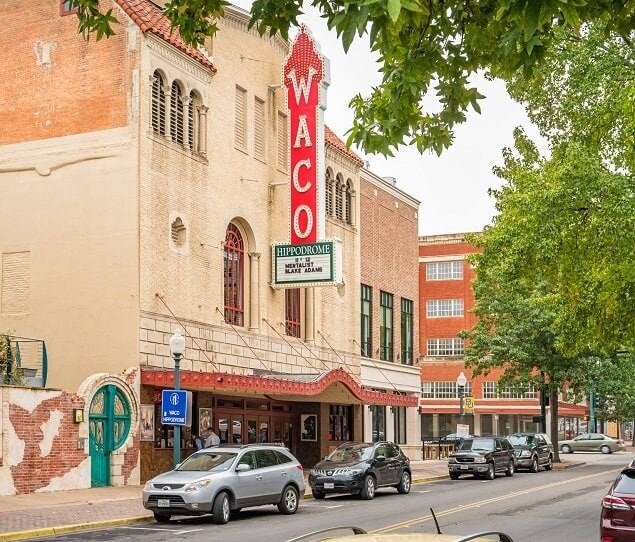
Downtown Waco continues to evolve, with Magnolia Market at the Silos serving as a central attraction. The city's outdoor spaces include a seven-mile riverwalk along the Brazos River and Cameron Park's 416 acres of hiking trails and limestone cliffs. Local landmarks showcase the city's history, from the Dr Pepper Museum - commemorating the drink's 1885 Waco origins - to the Waco Mammoth National Monument's Ice Age discoveries. Entertainment options include performances at the restored Waco Hippodrome, exhibits at local art galleries, and the Texas Sports Hall of Fame. Located between Dallas and Austin, Waco provides easy access to major metropolitan areas while maintaining its distinctive character.
The Hippodrome Theater is located in Downtown Waco
The Dr Pepper Museum is in the original bottling plant built in 1906.
Built in 1901, the McLennan County Courthouse is a National Historic Landmark
A mammoth fossil at the Waco Mammoth National Monument
As of March 2026, the average apartment rent in Waco, TX is $996 for a studio, $1,038 for one bedroom, $1,299 for two bedrooms, and $1,523 for three bedrooms. Apartment rent in Waco has decreased by -0.7% in the past year.
The cost of living in Waco, TX is 9.7% lower than the national average. Generally, housing in Waco is 19.3% less expensive than the national average, with rent falling between $996 - $1,523. You can expect to pay 8.1% less for groceries, 0.1% more for utilities, and 9.7% less for transportation.
Explore how walkable, bikeable, drivable, and transit-friendly Waco, TX is for everyday living.
Car-Dependent
This area is considered a car-dependent area and most errands will require a car.
Somewhat Bikeable
You might be able to find places to ride your bike in this area, but you’ll most likely want your car for most errands.
China Spring Elementary School
Public
Grades 2-4
677 Students

South Bosque Elementary School
Public
Grades PK-5
595 Students
Public
Grades PK-5
567 Students
Public
Grades PK-5
463 Students

China Spring Intermediate School
Public
Grades 5-6
461 Students

Public
Grades PK-8
697 Students

Public
Grades 6-8
161 Students
Public
Grades PK-12
262 Students

Public
Grades 6-8
999 Students

Public
Grades 6-8
840 Students

Public
Grades 9-12
2,648 Students
Public
Grades 9-12
218 Students
Public
Grades PK-12
262 Students
Public
Grades 9-12
2,011 Students
Public
Grades 9-12
1,678 Students

83
Communities
22,289
Units
53
Cities

3,490
Communities
959,772
Units
895
Cities

625
Communities
174,401
Units
249
Cities

70
Communities
21,163
Units
22
Cities

25
Communities
2,712
Units
16
Cities

35
Communities
6,136
Units
11
Cities
† Our analysis of utilities, groceries, transportation, healthcare, home prices, and other goods and services is sourced from the Cost of Living Index, a respected benchmark published by the Council for Community and Economic Research (C2ER) that provides a thorough overview of living expenses across different regions.
Rent data is provided by CoStar Group’s Market Trend reports. As the industry leader in commercial real estate information, analytics, and news, CoStar conducts extensive research to produce and maintain a comprehensive database of commercial real estate information. We combine this data with public record to provide the most up-to-date rental information available.
Consumer goods, services, and home prices are sourced from the Cost of Living Index published by the Council for Community and Economic Research (C2ER). The data on this page is updated quarterly. It was last published in February 2026.


