Median Age
39 Years
Largest Age Group
30-39 Years
Approximately 16% of Residents
Under 20
22%
Over 65
19%


Area Guide
Avg Rent
$1,553
Population
195,545
Renter Mix
52% Rent
Along the north bank of the Columbia River, Vancouver, Washington combines small-city charm with outdoor recreation opportunities. This historic city of nearly 200,000 residents features a revitalized downtown area centered around Esther Short Park and the Vancouver Waterfront development. Housing includes waterfront apartments, established neighborhood rentals, and historic homes, with current rental rates averaging $1,540 for one-bedroom apartments and $1,718 for two-bedroom units. The rental market has remained stable, with changes ranging from a 1% increase for one-bedroom units to a 1.7% increase for three-bedroom homes over the past year.
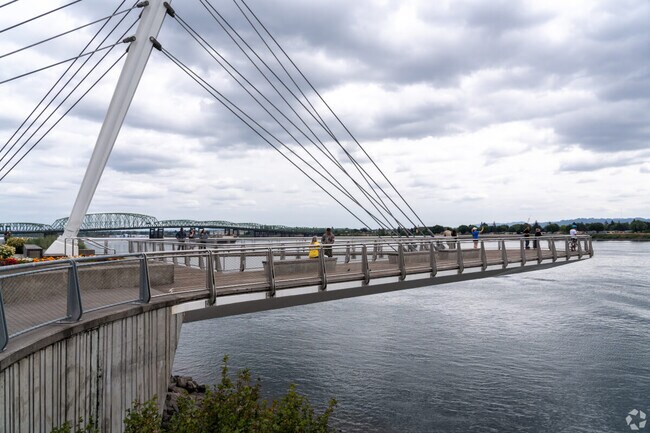
The city offers numerous recreational opportunities, from the Columbia River Waterfront Renaissance Trail to Fort Vancouver National Historic Site. Established in 1825 as a fur-trading outpost, Vancouver preserves its history while embracing modern development. The downtown Arts District features the restored Kiggins Theatre, an art deco landmark showing independent films. Washington State University Vancouver provides local educational opportunities, while the city's location near Portland, Oregon allows easy access to additional entertainment and employment options. Notable areas include the tree-lined streets of the Hough neighborhood, Fisher's Landing with its mix of housing options, and the Columbia River waterfront area, home to Grant Street Pier and waterfront parks.
Head to the Farmer's Market and explore fresh produce and flower arrangements.
The newly renovated playground at Ester Short Park in Vancouver is a family favorite.
The newly constructed waterfront in Vancouver offers beautiful views of the Colombia River.
Median Household Income
$71,366
Average: $89,444
Education
52,637
Residents Have a Degree
Job Market
97,698
Workers Employed
Median Age
39 Years
Largest Age Group
30-39 Years
Approximately 16% of Residents
Under 20
22%
Over 65
19%
Housing Distribution
Vancouver has more renters than homeowners.

Education Distribution
Review this city's overall education levels.

As of June 2026, the average apartment rent in Vancouver, WA is $1,398 for a studio, $1,551 for one bedroom, $1,737 for two bedrooms, and $2,130 for three bedrooms. Apartment rent in Vancouver has decreased by -0.7% in the past year.
The cost of living in Vancouver, WA is 6.1% higher than the national average. Generally, housing in Vancouver is 2.1% more expensive than the national average, with rent falling between $1,398 - $2,130. You can expect to pay 5.5% more for groceries, 7.2% less for utilities, and 16.1% more for transportation.
Compare Cities
Explore how walkable, bikeable, drivable, and transit-friendly Vancouver, WA is for everyday living.
Moderately Walkable
Walkability
Limited Public Transit
Transit
Exceptionally Drivable
Drivability
Moderately Bikeable
Bikeability
Public
Grades PK-5
580 Students

Glenwood Heights Primary School
Public
Grades PK-5
580 Students
Fishers Landing Elementary School
Public
Grades PK-5
462 Students
Public
Grades PK-5
639 Students

Public
Grades K-5
633 Students
Public
Grades 6-8
874 Students
Public
Grades 6-8
607 Students
Public
Grades 6-8
800 Students

Public
Grades 6-12
602 Students
Public
Grades 6-8
532 Students
Public
Grades 9-12
1,739 Students
Public
Grades 9-12
1,589 Students
Public
Grades 9-12
1,134 Students
Public
Grades 9-12
1,134 Students
Public
Grades 6-12
602 Students
† Our analysis of utilities, groceries, transportation, healthcare, home prices, and other goods and services is sourced from the Cost of Living Index, a respected benchmark published by the Council for Community and Economic Research (C2ER) that provides a thorough overview of living expenses across different regions.
Rent data is provided by CoStar Group’s Market Trend reports. As the industry leader in commercial real estate information, analytics, and news, CoStar conducts extensive research to produce and maintain a comprehensive database of commercial real estate information. We combine this data with public record to provide the most up-to-date rental information available.
Consumer goods, services, and home prices are sourced from the Cost of Living Index published by the Council for Community and Economic Research (C2ER). The data on this page is updated quarterly. It was last published in June 2026.
Demographic information comes from Neustar and combines detailed address data with U.S. Census and American Community Survey statistics to produce reliable local estimates.


