
The Arvon
11603 NE 71st St,
Vancouver, WA 98662
$1,700 - $2,740 Total Monthly Price
1-3 Beds
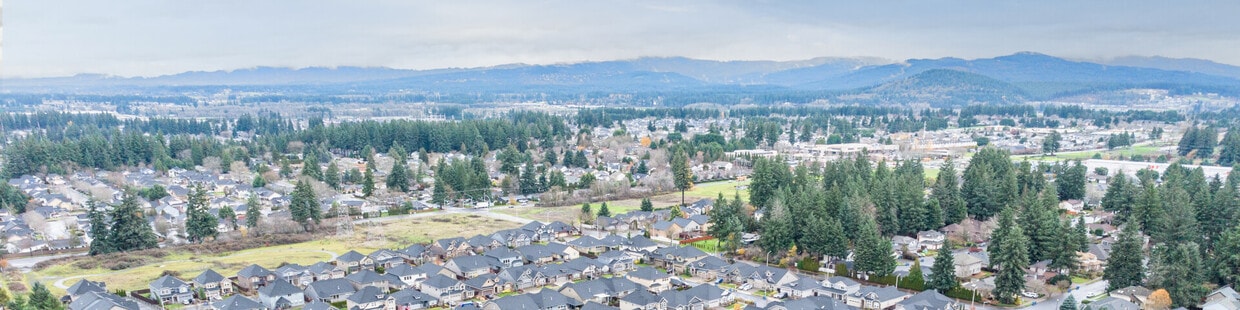


Along the north bank of the Columbia River, Vancouver, Washington combines small-city charm with outdoor recreation opportunities. This historic city of nearly 200,000 residents features a revitalized downtown area centered around Esther Short Park and the Vancouver Waterfront development. Housing includes waterfront apartments, established neighborhood rentals, and historic homes, with current rental rates averaging $1,540 for one-bedroom apartments and $1,718 for two-bedroom units. The rental market has remained stable, with changes ranging from a 1% increase for one-bedroom units to a 1.7% increase for three-bedroom homes over the past year.
The city offers numerous recreational opportunities, from the Columbia River Waterfront Renaissance Trail to Fort Vancouver National Historic Site. Established in 1825 as a fur-trading outpost, Vancouver preserves its history while embracing modern development. The downtown Arts District features the restored Kiggins Theatre, an art deco landmark showing independent films. Washington State University Vancouver provides local educational opportunities, while the city's location near Portland, Oregon allows easy access to additional entertainment and employment options. Notable areas include the tree-lined streets of the Hough neighborhood, Fisher's Landing with its mix of housing options, and the Columbia River waterfront area, home to Grant Street Pier and waterfront parks.
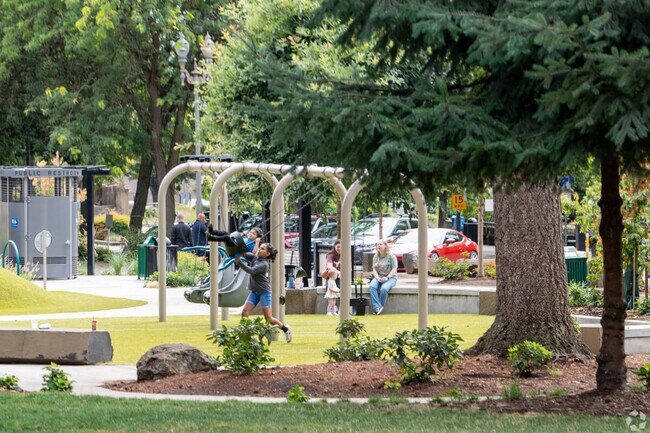
The newly renovated playground at Ester Short Park in Vancouver is a family favorite.
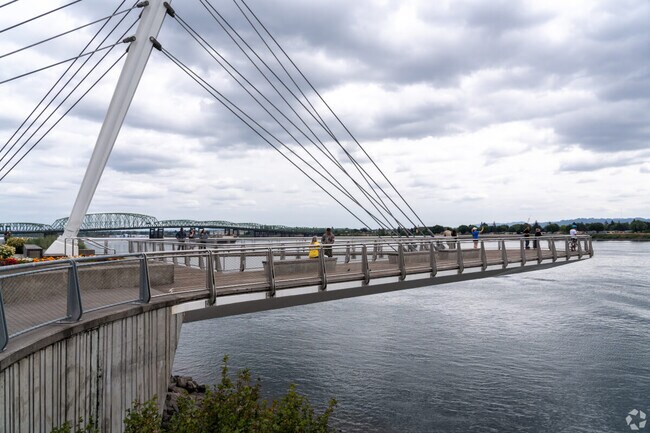
The newly constructed waterfront in Vancouver offers beautiful views of the Colombia River.
Head to the Farmer's Market and explore fresh produce and flower arrangements.
As of March 2026, the average apartment rent in Vancouver, WA is $1,390 for a studio, $1,541 for one bedroom, $1,709 for two bedrooms, and $2,116 for three bedrooms. Apartment rent in Vancouver has increased by 0.3% in the past year.
The cost of living in Vancouver, WA is 6.1% higher than the national average. Generally, housing in Vancouver is 2.1% more expensive than the national average, with rent falling between $1,390 - $2,116. You can expect to pay 5.5% more for groceries, 7.2% less for utilities, and 16.1% more for transportation.
Explore how walkable, bikeable, drivable, and transit-friendly Vancouver, WA is for everyday living.
Somewhat Walkable
You might be able to get out and walk when living in this area. Some errands can be accomplished on foot, but for others you’ll need a car.
Some Transit
You'll likely want a car when living in this area since it has few transit options.
Bikeable
While there’s some bike infrastructure in this area, you’ll still need a car for many errands.
Public
Grades PK-5

Fishers Landing Elementary School
Public
Grades PK-5
Public
Grades K-5

Public
Grades K-5
Public
Grades K-5
Public
Grades 6-8
Public
Grades 6-8
Public
Grades 6-12

Public
Grades 6-8
Public
Grades 6-8
Public
Grades 9-12
Public
Grades 9-12
Public
Grades 9-12
Public
Grades 6-12
Public
Grades 9-12


3,491
Communities
958,581
Units
894
Cities

625
Communities
125,220
Units
245
Cities

29
Communities
3,423
Units
13
Cities

26
Communities
8,329
Units
11
Cities

566
Communities
126,998
Units
222
Cities

64
Communities
3,986
Units
20
Cities
† Our analysis of utilities, groceries, transportation, healthcare, home prices, and other goods and services is sourced from the Cost of Living Index, a respected benchmark published by the Council for Community and Economic Research (C2ER) that provides a thorough overview of living expenses across different regions.
Rent data is provided by CoStar Group’s Market Trend reports. As the industry leader in commercial real estate information, analytics, and news, CoStar conducts extensive research to produce and maintain a comprehensive database of commercial real estate information. We combine this data with public record to provide the most up-to-date rental information available.
Consumer goods, services, and home prices are sourced from the Cost of Living Index published by the Council for Community and Economic Research (C2ER). The data on this page is updated quarterly. It was last published in February 2026.


