
Domaine at Napa Junction
300 Opus Ln,
American Canyon, CA 94503
$2,324 - $3,650
1-3 Beds
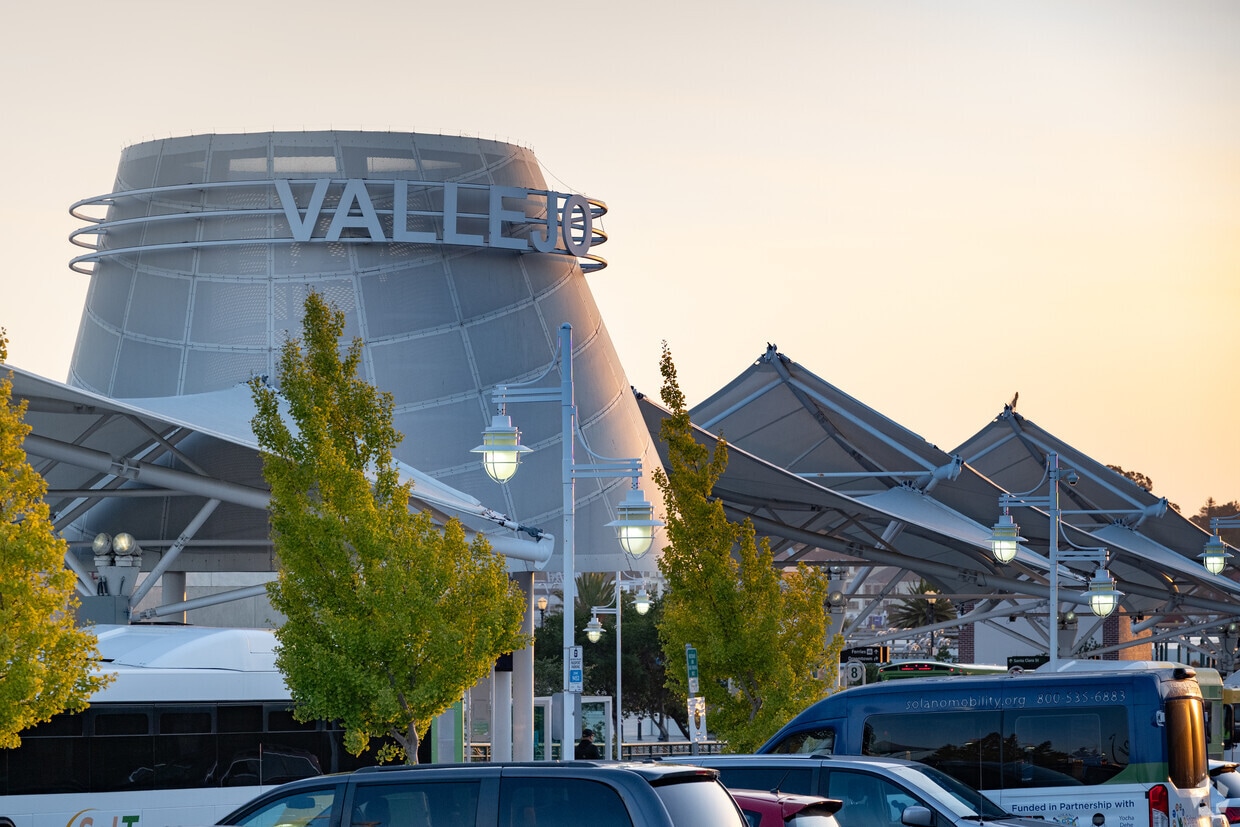
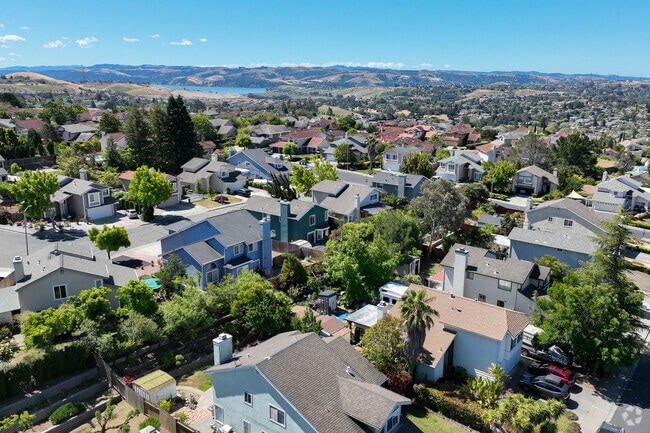
Nestled along San Pablo Bay in the North Bay region, Vallejo combines waterfront living with convenient access to the Bay Area. The city's neighborhoods feature a mix of historic Victorian homes and newer developments, while the downtown area showcases a growing arts scene. Current rental trends show moderate stability, with one-bedroom apartments averaging $1,770 per month, experiencing only a slight 0.4% decrease year-over-year, while two-bedroom units average $2,050 monthly. The waterfront location offers ferry service to San Francisco, making it convenient for Bay Area commuters.
Vallejo is home to the California State University Maritime Academy and Six Flags Discovery Kingdom. The historic Mare Island Naval Shipyard district has been transformed into a mixed-use development featuring restaurants, businesses, and residential areas. The monthly Art Walk downtown highlights local artists and galleries. Notable neighborhoods include St. Vincent's Hill, known for its preserved Victorian architecture, and the waterfront district with its bay views. The Mediterranean climate supports year-round outdoor activities at parks like Dan Foley Park and Blue Rock Springs Park.
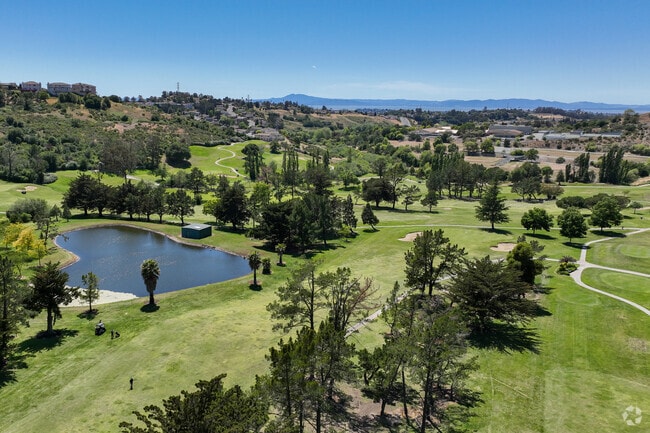
Blue Rock Springs Golf Course offers a top rated course and scenic views in East Vallejo.
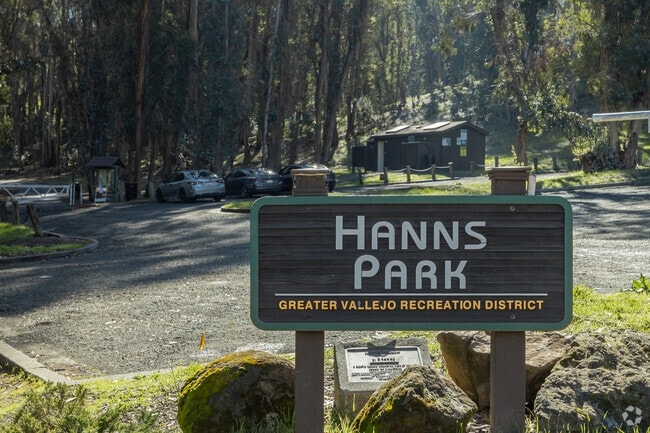
Hanns Park has a highly regarded disc golf course for East Vallejo residents to enjoy.
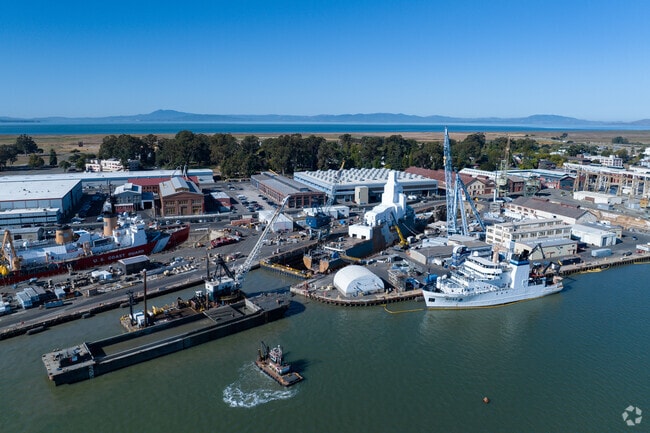
A working drydock employs some of the residents on Mare Island.
The Downtown Vallejo community comes together at their thriving farmer's market.
Many colorful and detailed homes are found in the Downtown Vallejo Heritage District.
Neighbors unite at local restaurants like the Good Day Cafe in Downtown Vallejo.
As of March 2026, the average apartment rent in Vallejo, CA is $1,302 for a studio, $1,725 for one bedroom, $2,038 for two bedrooms, and $2,505 for three bedrooms. Apartment rent in Vallejo has decreased by -2.7% in the past year.
Explore how walkable, bikeable, drivable, and transit-friendly Vallejo, CA is for everyday living.
Somewhat Walkable
You might be able to get out and walk when living in this area. Some errands can be accomplished on foot, but for others you’ll need a car.
Some Transit
You'll likely want a car when living in this area since it has few transit options.
Bikeable
While there’s some bike infrastructure in this area, you’ll still need a car for many errands.
Public
Grades K-8

Public
Grades K-5
Public
Grades K-5
Public
Grades K-5

Public
Grades K-5
Public
Grades K-8
Public
Grades K-8

Loma Vista Environmental Science Academy
Public
Grades K-8
Public
Grades K-8
Mare Island Technology Academy
Public
Grades 6-8

Public
Grades 9-12
Public
Grades 9-12
Public
Grades 9-12

3,489
Communities
959,639
Units
894
Cities

624
Communities
125,068
Units
245
Cities

28
Communities
15,185
Units
22
Cities

144
Communities
55,107
Units
78
Cities

74
Communities
28,604
Units
49
Cities

47
Communities
9,982
Units
33
Cities
† Our analysis of utilities, groceries, transportation, healthcare, home prices, and other goods and services is sourced from the Cost of Living Index, a respected benchmark published by the Council for Community and Economic Research (C2ER) that provides a thorough overview of living expenses across different regions.
Rent data is provided by CoStar Group’s Market Trend reports. As the industry leader in commercial real estate information, analytics, and news, CoStar conducts extensive research to produce and maintain a comprehensive database of commercial real estate information. We combine this data with public record to provide the most up-to-date rental information available.
Consumer goods, services, and home prices are sourced from the Cost of Living Index published by the Council for Community and Economic Research (C2ER). The data on this page is updated quarterly. It was last published in February 2026.


