
Andina Apartments
1180-1182 E St,
Hayward, CA 94541
$2,013 - $2,800
1-3 Beds


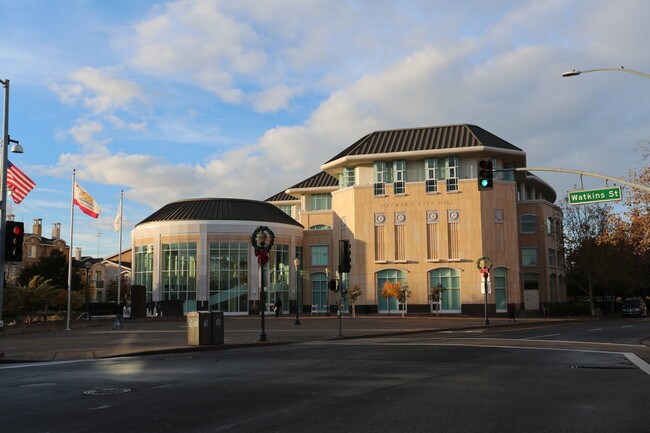
Situated in the northeastern-most part of Hayward, Upper B Street offers plenty of affordable rental options and convenient amenities along with easy access to several nearby highways and BART stations. Aside from its remarkable accessibility, Upper B Street’s quiet boulevards lined with charming bungalows and mature trees make the neighborhood stand out.
Located about one mile northeast of Downtown Hayward, Upper B Street is surrounded by a host of lush green spaces for residents to enjoy as well as numerous urban amenities. Hayward Japanese Gardens, Sulphur Creek Nature Center, Don Castro Regional Recreation Area, and Lake Chabot Regional Park are all situated within close proximity to the neighborhood.
The many metropolitan delights of San Francisco are about 27 miles northwest of Upper B Street. Southland Mall offers a bevy of shopping and dining opportunities a little closer to home, sitting just three miles southwest of the neighborhood.
As of March 2026, the average apartment rent in Upper B Street is $1,442 for a studio, $1,803 for one bedroom, $1,947 for two bedrooms, and $2,151 for three bedrooms. Apartment rent in Upper B Street has increased by 0.9% in the past year.
Studio
700 sq ft
Average Sq Ft
$1,442/month
Average Rent
1 BR
713 sq ft
Average Sq Ft
$1,803/month
Average Rent
2 BR
948 sq ft
Average Sq Ft
$1,947/month
Average Rent
3 BR
1,375 sq ft
Average Sq Ft
$2,151/month
Average Rent
Very Walkable
out of 100 WalkScore® Rating
If you enjoy walking, you’ll enjoy renting in this area! It’s a very walkable neighborhood.
Some Transit
out of 100 TransitScore® Rating
You'll likely want a car when living in this area since it has few transit options.
Bikeable
out of 100 BikeScore® Rating
While there’s some bike infrastructure in this area, you’ll still need a car for many errands.
Niche User
10 years and 6 months ago•Niche Review
When it comes to noises, it is very vociferous.

3,467
Communities
953,952
Units
894
Cities

725
Communities
200,750
Units
346
Cities

633
Communities
174,412
Units
247
Cities

630
Communities
125,693
Units
248
Cities

561
Communities
125,432
Units
220
Cities

467
Communities
110,723
Units
235
Cities
† Our analysis of utilities, groceries, transportation, healthcare, home prices, and other goods and services is sourced from the Cost of Living Index, a respected benchmark published by the Council for Community and Economic Research (C2ER) that provides a thorough overview of living expenses across different regions.
Rent data is provided by CoStar Group’s Market Trend reports. As the industry leader in commercial real estate information, analytics, and news, CoStar conducts extensive research to produce and maintain a comprehensive database of commercial real estate information. We combine this data with public record to provide the most up-to-date rental information available.
Consumer goods, services, and home prices are sourced from the Cost of Living Index published by the Council for Community and Economic Research (C2ER). The data on this page is updated quarterly. It was last published in February 2026.


