
Flanigan Square Lofts
547 River St,
Troy, NY 12180
$1,500 - $2,475
Studio - 2 Beds
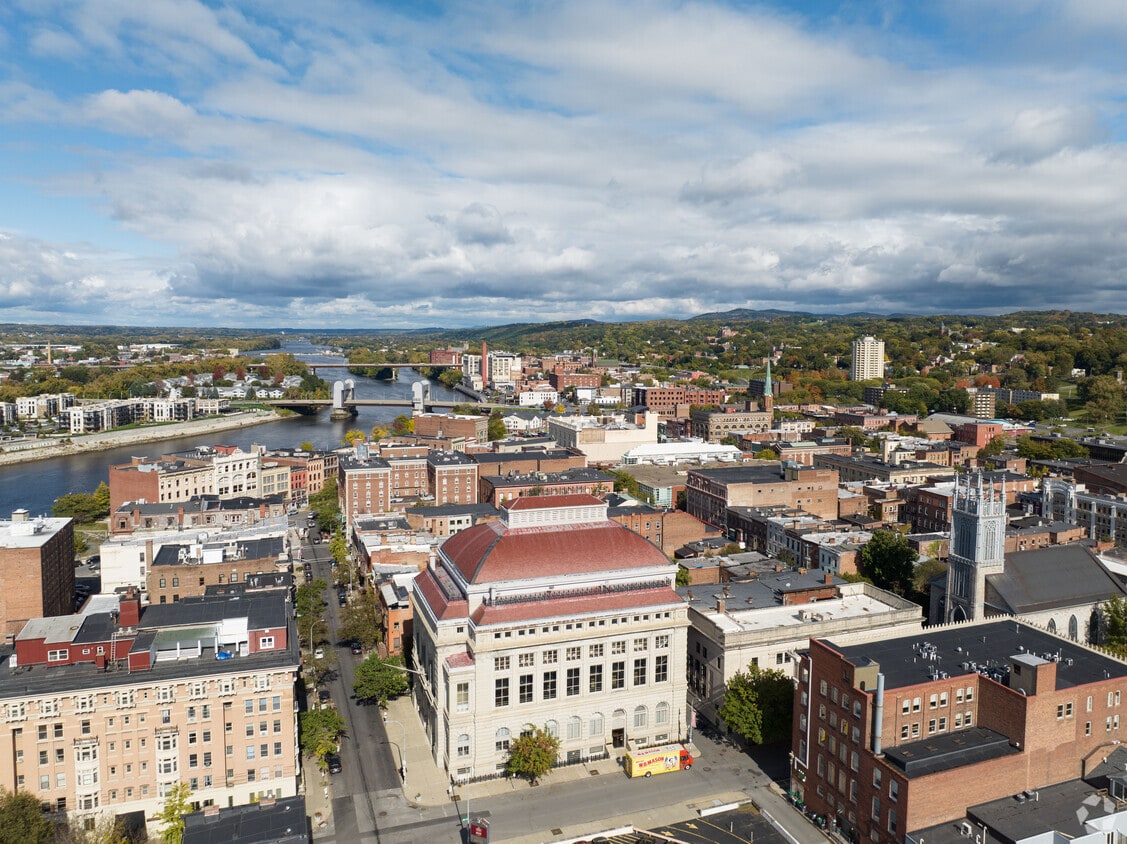
Welcome to Troy, New York, a historic riverside community along the Hudson River. This Capital District city, home to Rensselaer Polytechnic Institute (RPI) and Russell Sage College, combines educational institutions with rich cultural heritage. The rental market shows steady growth, with one-bedroom apartments currently priced at $1,399, reflecting a 4.2% increase over the past year. Two-bedroom units average $1,563, while larger homes can range up to $3,189 for four-bedroom properties. Downtown Troy features apartments in restored Victorian buildings and traditional brownstones, with additional residential options in neighborhoods like Lansingburgh.
Troy's community comes alive at the weekly Waterfront Farmers' Market along the Hudson River shoreline. Monument Square anchors downtown, where historic architecture frames local shops and restaurants. Outdoor enthusiasts appreciate Prospect Park's walking trails and the Uncle Sam Bike Trail for recreation. The city's industrial heritage as a collar-manufacturing center earned its "Collar City" nickname, while today's Troy embraces arts and technology. Distinctive areas include the Washington Park Historic District, known for its preserved Victorian architecture, and the South Central neighborhood, which offers a range of housing options. The neighborhoods surrounding RPI and Russell Sage College feature a mix of historic homes and modern apartments.
As of March 2026, the average apartment rent in Troy, NY is $1,340 for a studio, $1,422 for one bedroom, $1,603 for two bedrooms, and $2,373 for three bedrooms. Apartment rent in Troy has increased by 1.8% in the past year.
Explore how walkable, bikeable, drivable, and transit-friendly Troy, NY is for everyday living.
Somewhat Walkable
You might be able to get out and walk when living in this area. Some errands can be accomplished on foot, but for others you’ll need a car.
Some Transit
You'll likely want a car when living in this area since it has few transit options.
Somewhat Bikeable
You might be able to find places to ride your bike in this area, but you’ll most likely want your car for most errands.
Public
Grades PK-8

Public
Grades K-5

Public
Grades PK-5
Public
Grades PK-5

Public
Grades K-5
Public
Grades PK-8
True North Troy Preparatory Charter School
Public
Grades K-12
Public
Grades 6-8

Tamarac Middle School High School
Public
Grades PK-12
Public
Grades 6-8
True North Troy Preparatory Charter School
Public
Grades K-12
Lansingburgh Senior High School
Public
Grades 9-12
Tamarac Middle School High School
Public
Grades PK-12
Public
Grades 9-12

10
Communities
1,445
Units
5
Cities
20
Communities
1,420
Units
4
Cities

42
Communities
9,401
Units
19
Cities

19
Communities
3,589
Units
15
Cities

16
Communities
2,019
Units
13
Cities

16
Communities
1,834
Units
11
Cities
† Our analysis of utilities, groceries, transportation, healthcare, home prices, and other goods and services is sourced from the Cost of Living Index, a respected benchmark published by the Council for Community and Economic Research (C2ER) that provides a thorough overview of living expenses across different regions.
Rent data is provided by CoStar Group’s Market Trend reports. As the industry leader in commercial real estate information, analytics, and news, CoStar conducts extensive research to produce and maintain a comprehensive database of commercial real estate information. We combine this data with public record to provide the most up-to-date rental information available.
Consumer goods, services, and home prices are sourced from the Cost of Living Index published by the Council for Community and Economic Research (C2ER). The data on this page is updated quarterly. It was last published in February 2026.


