Median Age
37 Years
Largest Age Group
35-44 Years
Approximately 15% of Residents
Under 20
26%
Over 65
13%
Avg Rent
$1,538
Population
143,965
Renter Mix
29% Rent
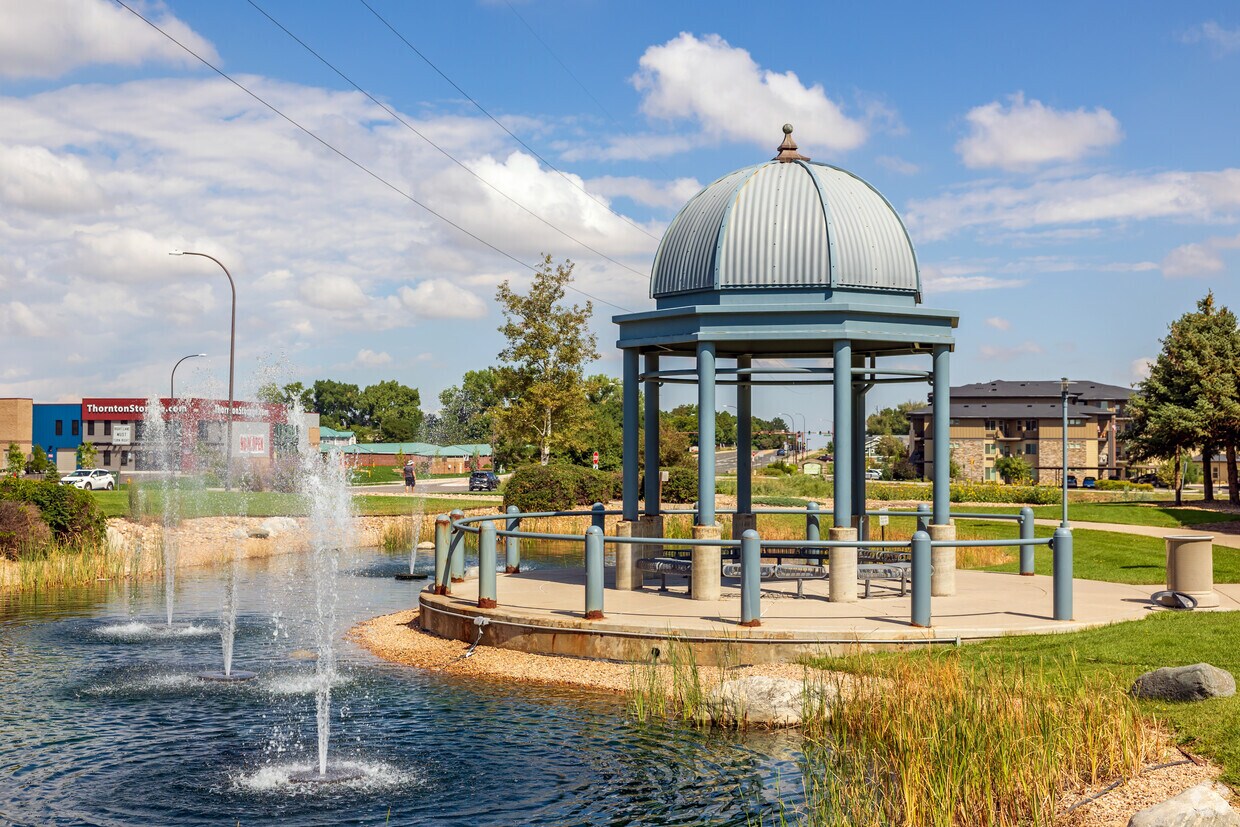
Located 10 miles north of downtown Denver, Thornton combines suburban living with easy city access. This planned community features 81 city parks and nearly 2,000 acres of open space, connected by 80 miles of trails. Residents can enjoy year-round activities at the Margaret Carpenter Recreation Center and Thorncreek Golf Course. The rental market currently shows one-bedroom apartments averaging $1,597, with rates decreasing 2.7% over the past year.
Housing options range from apartments to single-family homes, with several communities near the N Line commuter rail stations providing direct access to downtown Denver. The city's location along Interstate 25 and E-470 offers convenient commuting options throughout the metro area. Established in 1953, Thornton has grown into a community of more than 141,000 residents. The city features shopping destinations like Larkridge Mall and Thornton Town Center, while its elevation provides scenic Rocky Mountain views and access to outdoor activities.
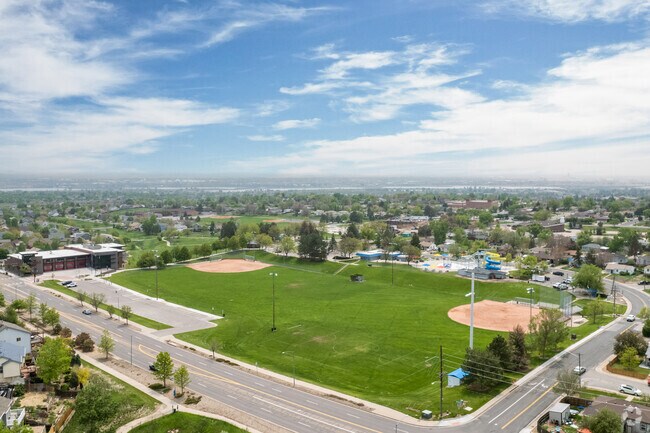
The Baseball Fields and Waterpark at the Community Park in Greater Thornton, Colorado.
Median Household Income
$92,872
Average: $109,677
Education
35,207
Residents Have a Degree
Job Market
81,245
Workers Employed
Median Age
37 Years
Largest Age Group
35-44 Years
Approximately 15% of Residents
Under 20
26%
Over 65
13%
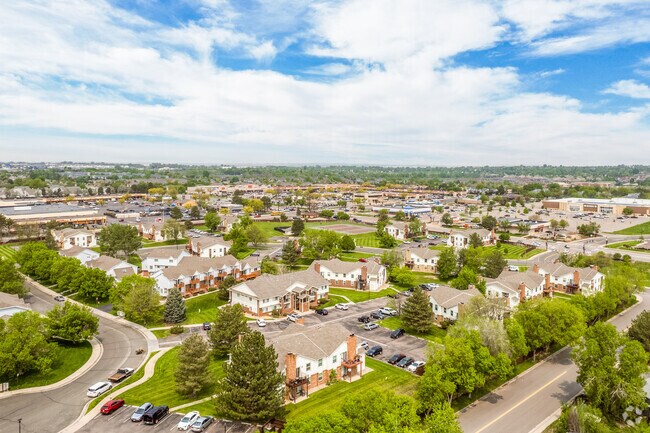
Housing Distribution
Thornton has more homeowners than renters.

Education Distribution
Review this city's overall education levels.

As of July 2026, the average apartment rent in Thornton, CO is $1,434 for a studio, $1,538 for one bedroom, $1,856 for two bedrooms, and $2,486 for three bedrooms. Apartment rent in Thornton has decreased by -0.4% in the past year.
Explore how walkable, bikeable, drivable, and transit-friendly Thornton, CO is for everyday living.
Fairly Walkable
Walkability
Limited Public Transit
Transit
Very Drivable
Drivability
Moderately Bikeable
Bikeability
Public
Grades K-12
1,572 Students

Silver Creek Elementary School
Public
Grades K-5
565 Students

Public
Grades K-5
565 Students
Public
Grades K-12
540 Students
Public
Grades PK-5
484 Students
Public
Grades K-12
1,572 Students
Public
Grades 6-8
1,001 Students
Public
Grades K-12
540 Students
Public
Grades K-12
776 Students

Mapleton Expeditionary School Of The Arts
Public
Grades 6-12
478 Students
Public
Grades K-12
1,572 Students
Public
Grades K-12
540 Students
Public
Grades 9-12
1,784 Students
Public
Grades K-12
776 Students
Mapleton Expeditionary School Of The Arts
Public
Grades 6-12
478 Students
† Our analysis of utilities, groceries, transportation, healthcare, home prices, and other goods and services is sourced from the Cost of Living Index, a respected benchmark published by the Council for Community and Economic Research (C2ER) that provides a thorough overview of living expenses across different regions.
Rent data is provided by CoStar Group’s Market Trend reports. As the industry leader in commercial real estate information, analytics, and news, CoStar conducts extensive research to produce and maintain a comprehensive database of commercial real estate information. We combine this data with public record to provide the most up-to-date rental information available.
Consumer goods, services, and home prices are sourced from the Cost of Living Index published by the Council for Community and Economic Research (C2ER). The data on this page is updated quarterly. It was last published in June 2026.
Demographic information comes from Neustar and combines detailed address data with U.S. Census and American Community Survey statistics to produce reliable local estimates.


