Median Age
42 Years
Largest Age Group
40-49 Years
Approximately 13% of Residents
Under 20
23%
Over 65
21%


Avg Rent
$2,035
Population
30,471
Renter Mix
37% Rent
People who move to Springfield choose this cozy neighborhood for its quiet residential feel and modern amenities. Locals enjoy abundant shopping and dining options at Springfield Town Center, the Springfield Plaza Commuter, the Tower Shopping Center, and the Concord Shopping Center. Excellent for families, residents also have access to great schools and a plethora of neighborhood parks. Only 10 miles west of Alexandria, residents can indulge in the city’s colorful nightlife. The city is great for commuters as well since it houses three major interstates including the Capital Beltway. If you want the perfect blend of urban and suburban living, consider Springfield the location for your next apartment.
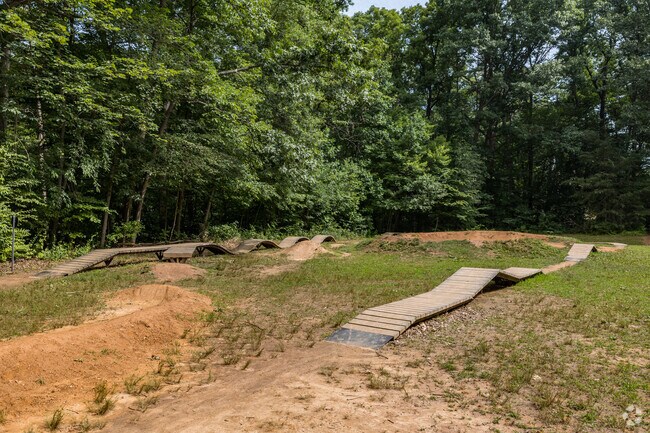
Experience the thrill of off-road biking in Springfield's dirt bike skill court.
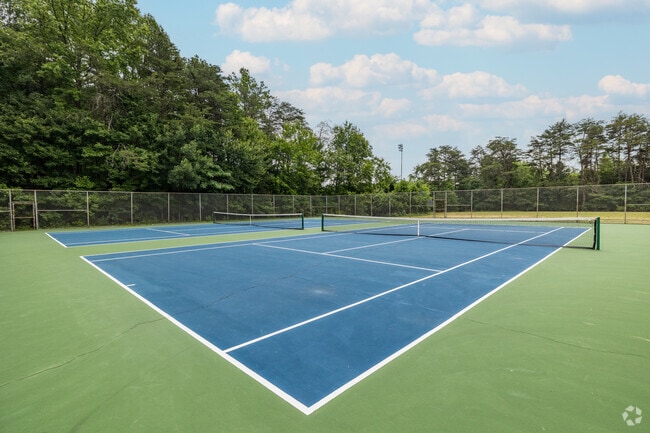
Serve up the Fun in Springfield at Our Tennis Court.
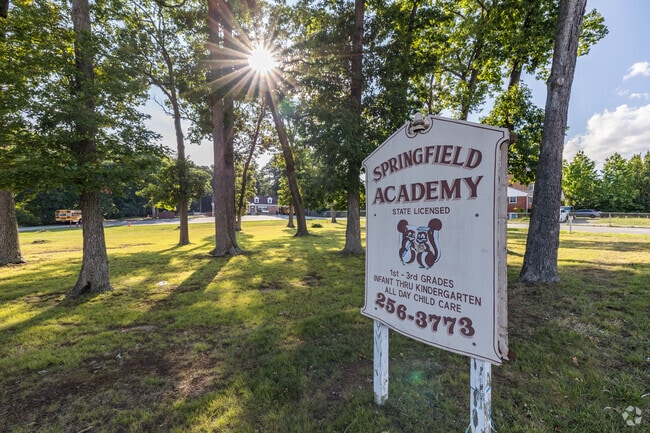
Springfield Academy: Empowering Education for Springfield's Future
Discover literary treasures at Springfield's charming, locally-loved book store.
Discover a world of wholesome choices at Whole Foods Market in the heart of Springfield.
A winter day full of adventure for kids at Springfield's cozy and vibrant indoor playground.
Median Household Income
$117,856
Average: $140,372
Education
11,654
Residents Have a Degree
Job Market
15,226
Workers Employed
Median Age
42 Years
Largest Age Group
40-49 Years
Approximately 13% of Residents
Under 20
23%
Over 65
21%
Housing Distribution
Springfield has more homeowners than renters.

Education Distribution
Review this city's overall education levels.

As of July 2026, the average apartment rent in Springfield, VA is $1,958 for a studio, $2,026 for one bedroom, $2,534 for two bedrooms, and $3,520 for three bedrooms. Apartment rent in Springfield has increased by 0.3% in the past year.
Explore how walkable, bikeable, drivable, and transit-friendly Springfield, VA is for everyday living.
Fairly Walkable
Walkability
Limited Public Transit
Transit
Exceptionally Drivable
Drivability
Moderately Bikeable
Bikeability
Public
Grades PK-5
815 Students

West Springfield Elementary School
Public
Grades PK-5
543 Students
Public
Grades PK-5
925 Students

Public
Grades PK-5
925 Students
Cardinal Forest Elementary School
Public
Grades PK-5
711 Students
Public
Grades 6-8
1,214 Students
Public
Grades 6-8
1,163 Students

Public
Grades 6-8
680 Students

Public
Grades 6-8
680 Students
Public
Grades 9-12
2,809 Students
Public
Grades 9-12
2,663 Students

Public
Grades 9-12
1,659 Students

† Our analysis of utilities, groceries, transportation, healthcare, home prices, and other goods and services is sourced from the Cost of Living Index, a respected benchmark published by the Council for Community and Economic Research (C2ER) that provides a thorough overview of living expenses across different regions.
Rent data is provided by CoStar Group’s Market Trend reports. As the industry leader in commercial real estate information, analytics, and news, CoStar conducts extensive research to produce and maintain a comprehensive database of commercial real estate information. We combine this data with public record to provide the most up-to-date rental information available.
Consumer goods, services, and home prices are sourced from the Cost of Living Index published by the Council for Community and Economic Research (C2ER). The data on this page is updated quarterly. It was last published in June 2026.
Demographic information comes from Neustar and combines detailed address data with U.S. Census and American Community Survey statistics to produce reliable local estimates.


