Median Age
35 Years
Largest Age Group
20-29 Years
Approximately 20% of Residents
Under 20
22%
Over 65
17%


Area Guide
Avg Rent
$913
Population
176,494
Renter Mix
58% Rent
Welcome to Springfield, Missouri, where small-city convenience meets Ozark Mountain charm. As the "Queen City of the Ozarks," Springfield offers an array of rental options from downtown lofts to suburban apartments. The rental market remains affordable, with one-bedroom apartments averaging $862 monthly, showing a 4.5% annual increase. The historic Rountree district features character-rich streets, while University Heights and Phelps Grove offer a mix of classic and contemporary housing options near Missouri State University's campus.
Downtown Springfield centers around Park Central Square, home to the restored 1926 Gillioz Theatre. The Springfield Botanical Gardens at Nathanael Greene Park includes the Mizumoto Japanese Stroll Garden, offering peaceful walks among traditional landscaping. The city houses the Bass Pro Shops national headquarters and the connected Wonders of Wildlife Museum & Aquarium. With Missouri State University's campus and major healthcare providers CoxHealth and Mercy, residents enjoy access to education and medical facilities. Springfield's claim to fame as the birthplace of Route 66 is celebrated through historic markers downtown and an annual festival. The city's location in the Ozarks provides easy access to regional trails and lakes while maintaining the conveniences of city living.
The Tumbler is an iconic art installation in Downtown Springfield that is rotated seasonally.
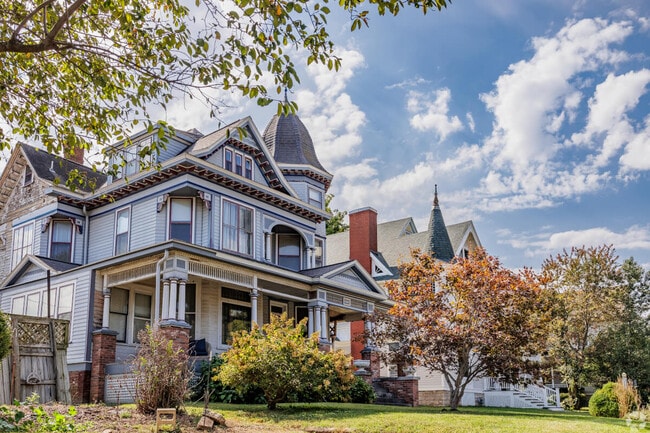
Elaborate queen anne and victorian homes sit side by side along historic Walnut Street in Springfield.
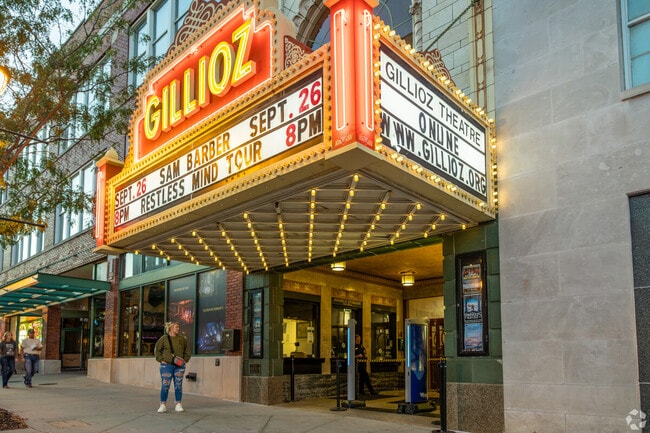
Springfields Gillioz Theater is a historical site with big name shows throughout the year.
Median Household Income
$44,545
Average: $62,996
Education
46,838
Residents Have a Degree
Job Market
84,691
Workers Employed
Median Age
35 Years
Largest Age Group
20-29 Years
Approximately 20% of Residents
Under 20
22%
Over 65
17%
Housing Distribution
Springfield has more renters than homeowners.

Education Distribution
Review this city's overall education levels.

As of June 2026, the average apartment rent in Springfield, MO is $866 for a studio, $912 for one bedroom, $1,084 for two bedrooms, and $1,485 for three bedrooms. Apartment rent in Springfield has increased by 2.0% in the past year.
The cost of living in Springfield, MO is 7.8% lower than the national average. Generally, housing in Springfield is 10.1% less expensive than the national average, with rent falling between $866 - $1,485. You can expect to pay 5.9% less for groceries, 21.2% less for utilities, and 10.5% less for transportation.
Compare Cities
Explore how walkable, bikeable, drivable, and transit-friendly Springfield, MO is for everyday living.
Moderately Walkable
Walkability
Limited Public Transit
Transit
Exceptionally Drivable
Drivability
Fairly Bikeable
Bikeability
Public
Grades K-5
568 Students

Public
Grades K-5
568 Students
Public
Grades K-5
344 Students
Public
Grades K-5
344 Students
David Harrison Elementary School
Public
Grades PK-5
288 Students
Public
Grades 6-8
414 Students

Public
Grades 6-8
414 Students
Public
Grades 6-8
758 Students

Public
Grades 6-8
758 Students
Public
Grades 6-8
695 Students
Public
Grades 9-12
1,881 Students
Public
Grades 9-12
1,881 Students
Public
Grades 9-12
1,307 Students
Public
Grades 9-12
1,307 Students
Public
Grades 6-12
1,464 Students

† Our analysis of utilities, groceries, transportation, healthcare, home prices, and other goods and services is sourced from the Cost of Living Index, a respected benchmark published by the Council for Community and Economic Research (C2ER) that provides a thorough overview of living expenses across different regions.
Rent data is provided by CoStar Group’s Market Trend reports. As the industry leader in commercial real estate information, analytics, and news, CoStar conducts extensive research to produce and maintain a comprehensive database of commercial real estate information. We combine this data with public record to provide the most up-to-date rental information available.
Consumer goods, services, and home prices are sourced from the Cost of Living Index published by the Council for Community and Economic Research (C2ER). The data on this page is updated quarterly. It was last published in June 2026.
Demographic information comes from Neustar and combines detailed address data with U.S. Census and American Community Survey statistics to produce reliable local estimates.

")


