Median Age
39 Years
Largest Age Group
50-59 Years
Approximately 15% of Residents
Under 20
25%
Over 65
14%


Avg Rent
$1,823
Population
25,304
Renter Mix
19% Rent
Tucked along the Fox River in Kane County, South Elgin is a suburban village where the water sets the pace and Chicago is just under an hour away. The Fox River Trolley Museum is a true local landmark, preserving a piece of American transit history that draws curious visitors year after year. Each summer, Riverfest brings the community together along the riverbanks for food, entertainment, and outdoor fun. Day-to-day life here centers around green spaces, riverside trails, and easy access to shopping and dining along Route 31, with neighboring St. Charles and Elgin offering even more options just a short drive away.
Renters in South Elgin will find a solid mix of townhomes, spacious apartment communities, and newer builds that cater to a range of lifestyles and space needs. Whether you're looking for a cozy studio or a three-bedroom layout, the rental market here offers comfortable options without the density of larger metro areas. Commuters benefit from Pace bus routes and proximity to Chicago O'Hare International Airport, making it easy to stay connected to the greater Chicagoland region while enjoying a quieter, more relaxed home base.
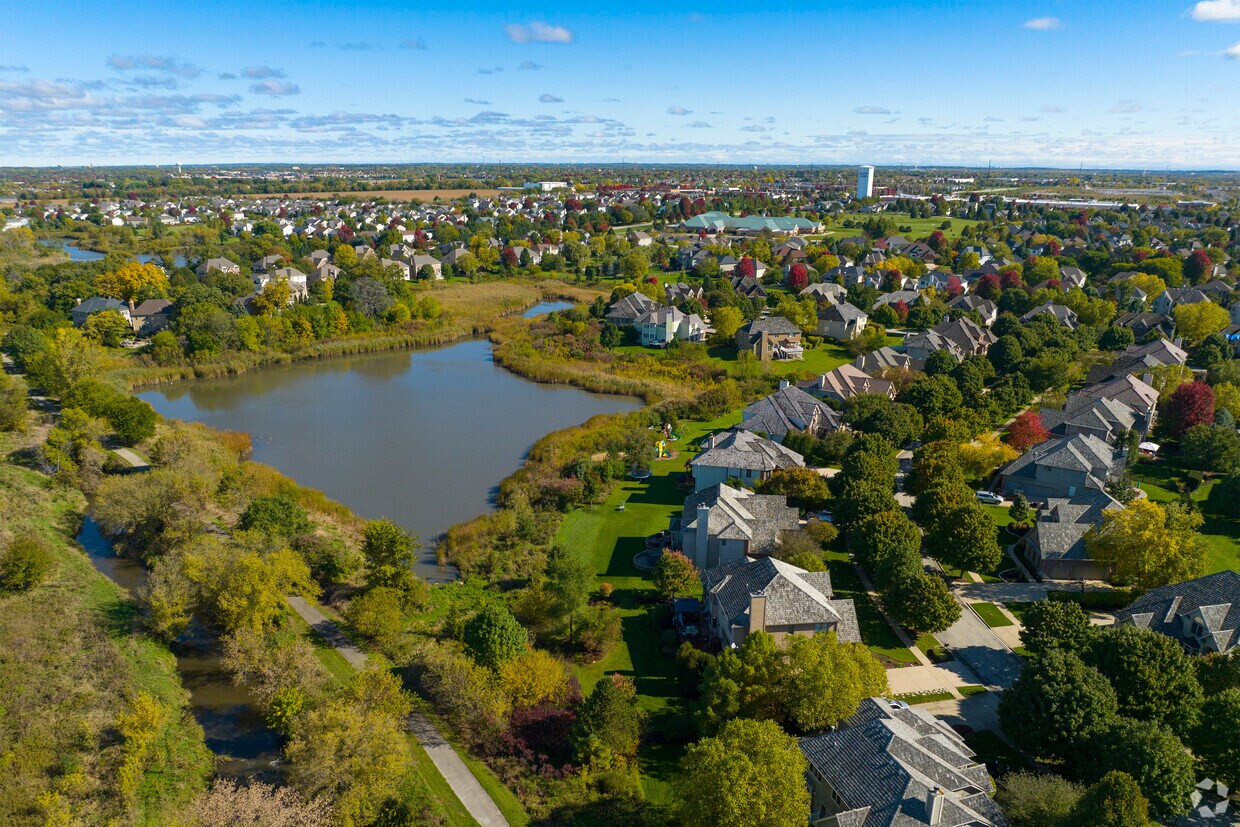
Five Islands Park water view tree lined.
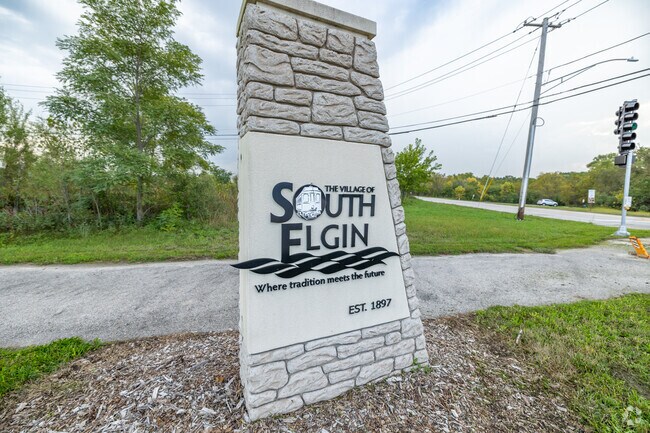
South Elgin stone plaque right outside of the Vasa park entrance area.
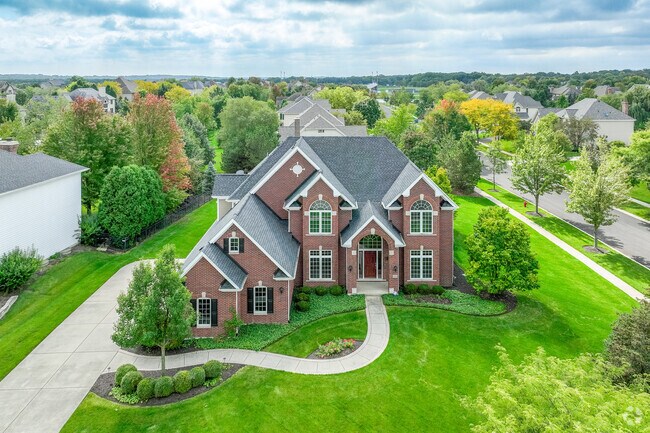
Large brick style home on a large lot, located within the Five Islands Park Community.
Residents can use the Metra located in Elgin to be in Chicago in an hour and a half.
The crowd love the music at Scandinavian Day Festival in Downtown South Elgin.
Get some fresh produce at the Downtown South Elgin Market during the summer months.
Median Household Income
$114,292
Average: $134,604
Education
7,198
Residents Have a Degree
Job Market
13,611
Workers Employed
Median Age
39 Years
Largest Age Group
50-59 Years
Approximately 15% of Residents
Under 20
25%
Over 65
14%
Housing Distribution
South Elgin has more homeowners than renters.

Education Distribution
Review this city's overall education levels.

As of July 2026, the average apartment rent in South Elgin, IL is $1,658 for a studio, $1,784 for one bedroom, $2,095 for two bedrooms, and $2,700 for three bedrooms. Apartment rent in South Elgin has decreased by -2.2% in the past year.
Explore how walkable, bikeable, drivable, and transit-friendly South Elgin, IL is for everyday living.
Fairly Walkable
Walkability
Exceptionally Drivable
Drivability
Fairly Bikeable
Bikeability
Public
Grades K-5
468 Students

Public
Grades PK-5
445 Students

Public
Grades K-5
254 Students

Public
Grades PK-5
479 Students

Public
Grades 6-8
773 Students
Public
Grades 9-12
2,689 Students

† Our analysis of utilities, groceries, transportation, healthcare, home prices, and other goods and services is sourced from the Cost of Living Index, a respected benchmark published by the Council for Community and Economic Research (C2ER) that provides a thorough overview of living expenses across different regions.
Rent data is provided by CoStar Group’s Market Trend reports. As the industry leader in commercial real estate information, analytics, and news, CoStar conducts extensive research to produce and maintain a comprehensive database of commercial real estate information. We combine this data with public record to provide the most up-to-date rental information available.
Consumer goods, services, and home prices are sourced from the Cost of Living Index published by the Council for Community and Economic Research (C2ER). The data on this page is updated quarterly. It was last published in June 2026.
Demographic information comes from Neustar and combines detailed address data with U.S. Census and American Community Survey statistics to produce reliable local estimates.


