825 De la Vina St
825 De la Vina St,
Santa Barbara, CA 93101
$5,500 - $12,000
1-3 Beds
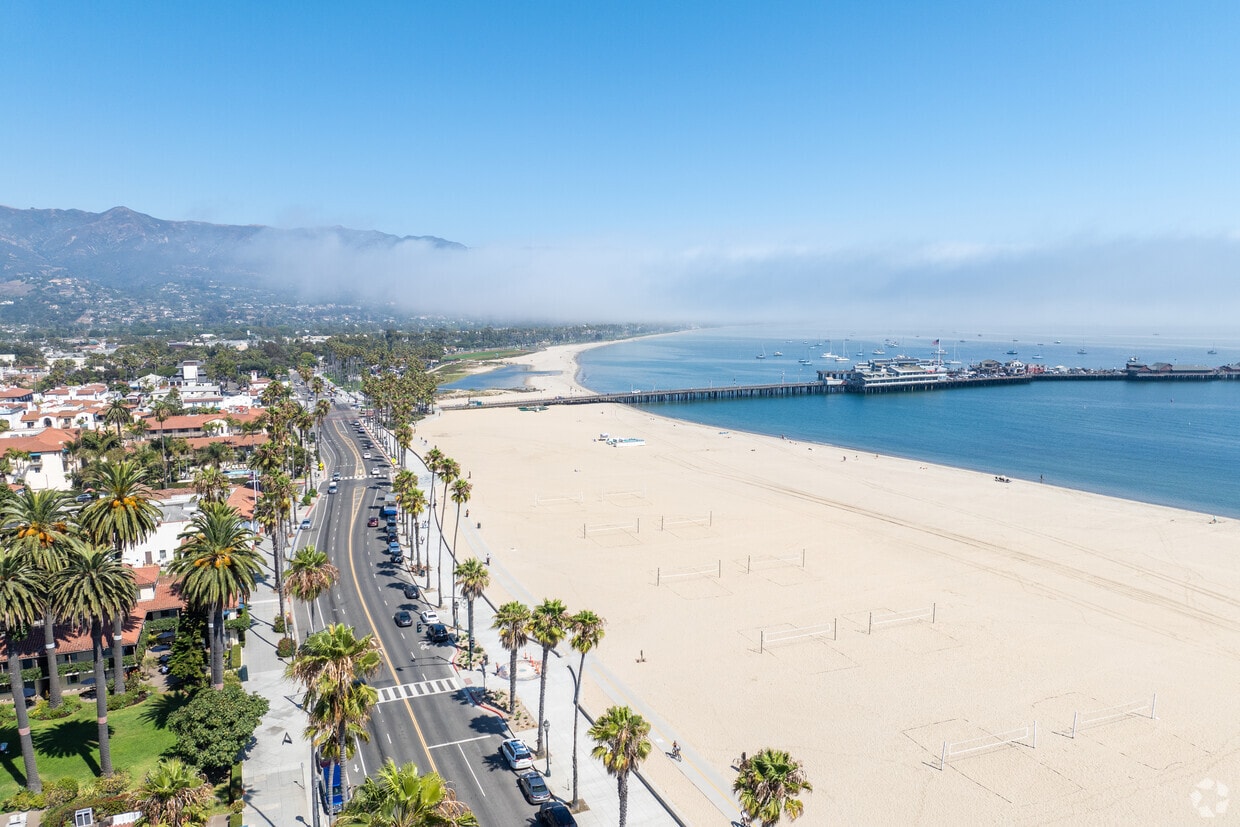
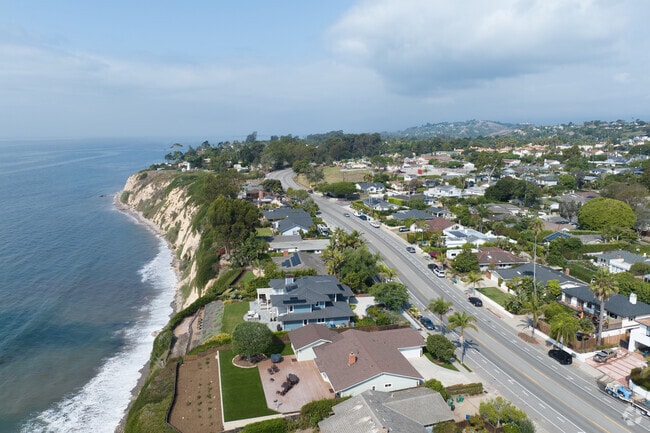
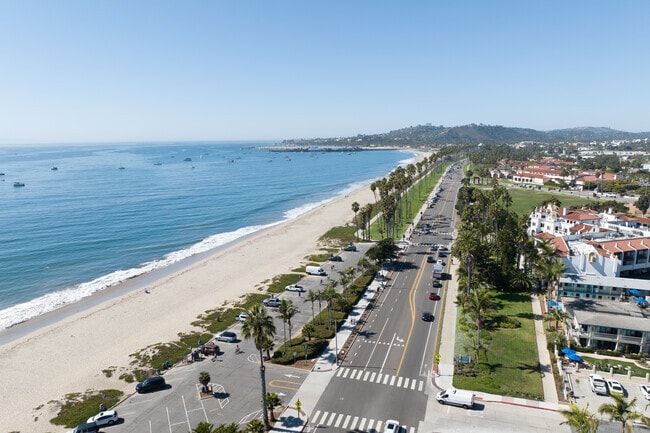
Between the Santa Ynez Mountains and the Pacific Ocean, Santa Barbara combines coastal living with Mediterranean-style architecture. The city's Spanish Colonial Revival buildings and year-round mild climate have earned it the nickname "The American Riviera." The rental market remains competitive, with one-bedroom apartments averaging $2,224 per month (up 3.6% year-over-year), while two-bedrooms average $3,235 (up 2.6%). The Mesa and Upper State Street areas feature apartment communities and rental homes near beaches and downtown.
Santa Barbara's outdoor lifestyle centers around its beaches, State Street shopping district, and the historic Mission Santa Barbara. The University of California Santa Barbara campus contributes to the area's educational atmosphere. Local events include farmers' markets throughout the week and the annual Santa Barbara International Film Festival. Residents have access to numerous hiking trails and bike paths, including Rattlesnake Canyon trail. The city holds an interesting place in cinema history - Flying A Studios operated here from 1910 to 1922, producing approximately 1,200 silent films before the industry shifted to Hollywood.
East Beach residents are only minutes away from the Pacific Ocean.
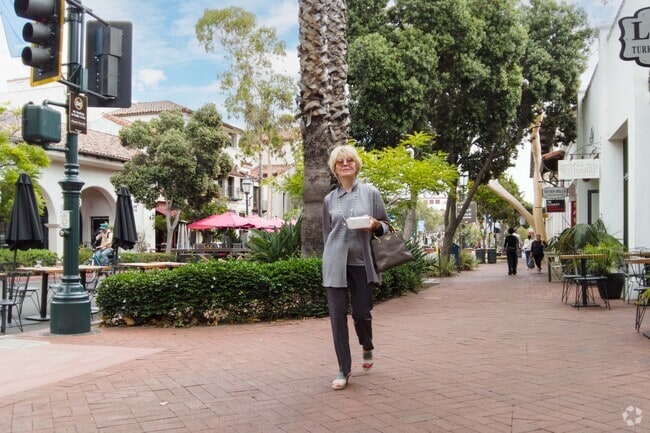
West Downtown Santa Barbara is a very walkable neighborhood.
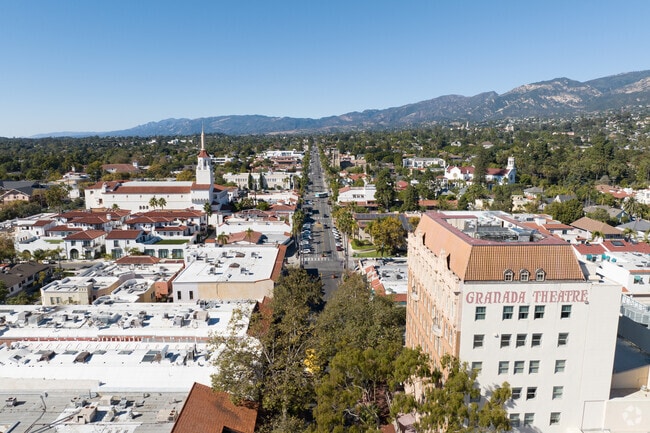
Downtown Santa Barbara is located between the ocean and mountains.
Lower State Santa Barbara is very central to the city.
Locals head to East Beach to surf a good beach break.
Paseo Nuevo is a bustling shopping center located off State Street in Santa Barbara.
As of April 2026, the average apartment rent in Santa Barbara, CA is $2,156 for a studio, $2,303 for one bedroom, $3,463 for two bedrooms, and $4,336 for three bedrooms. Apartment rent in Santa Barbara has increased by 0.7% in the past year.
Explore how walkable, bikeable, drivable, and transit-friendly Santa Barbara, CA is for everyday living.
Fairly Walkable
Walkability
Limited Public Transit
Transit
Moderately Drivable
Drivability
Moderately Bikeable
Bikeability
Public
Grades K-5
353 Students

Public
Grades K-5
313 Students
Public
Grades K-5
267 Students
Public
Grades K-5
780 Students

Public
Grades K-5
351 Students
Public
Grades 6-8
832 Students

Public
Grades 6-8
426 Students

Public
Grades 6-8
512 Students

Santa Barbara County Community
Public
Grades K-12
27 Students

Santa Barbara County Special Education School
Public
Grades K-12
49 Students

Public
Grades 9-12
1,926 Students
Public
Grades 9-12
1,924 Students
Santa Barbara County Community
Public
Grades K-12
27 Students
La Cuesta Continuation High School
Public
Grades 9-12
Santa Barbara County Special Education School
Public
Grades K-12
49 Students
† Our analysis of utilities, groceries, transportation, healthcare, home prices, and other goods and services is sourced from the Cost of Living Index, a respected benchmark published by the Council for Community and Economic Research (C2ER) that provides a thorough overview of living expenses across different regions.
Rent data is provided by CoStar Group’s Market Trend reports. As the industry leader in commercial real estate information, analytics, and news, CoStar conducts extensive research to produce and maintain a comprehensive database of commercial real estate information. We combine this data with public record to provide the most up-to-date rental information available.
Consumer goods, services, and home prices are sourced from the Cost of Living Index published by the Council for Community and Economic Research (C2ER). The data on this page is updated quarterly. It was last published in February 2026.
Demographic information comes from Neustar and combines detailed address data with U.S. Census and American Community Survey statistics to produce reliable local estimates.