
Mission Trail at El Camino Real
3085 Highway 123,
San Marcos, TX 78666
$1,006 - $1,775
1-4 Beds
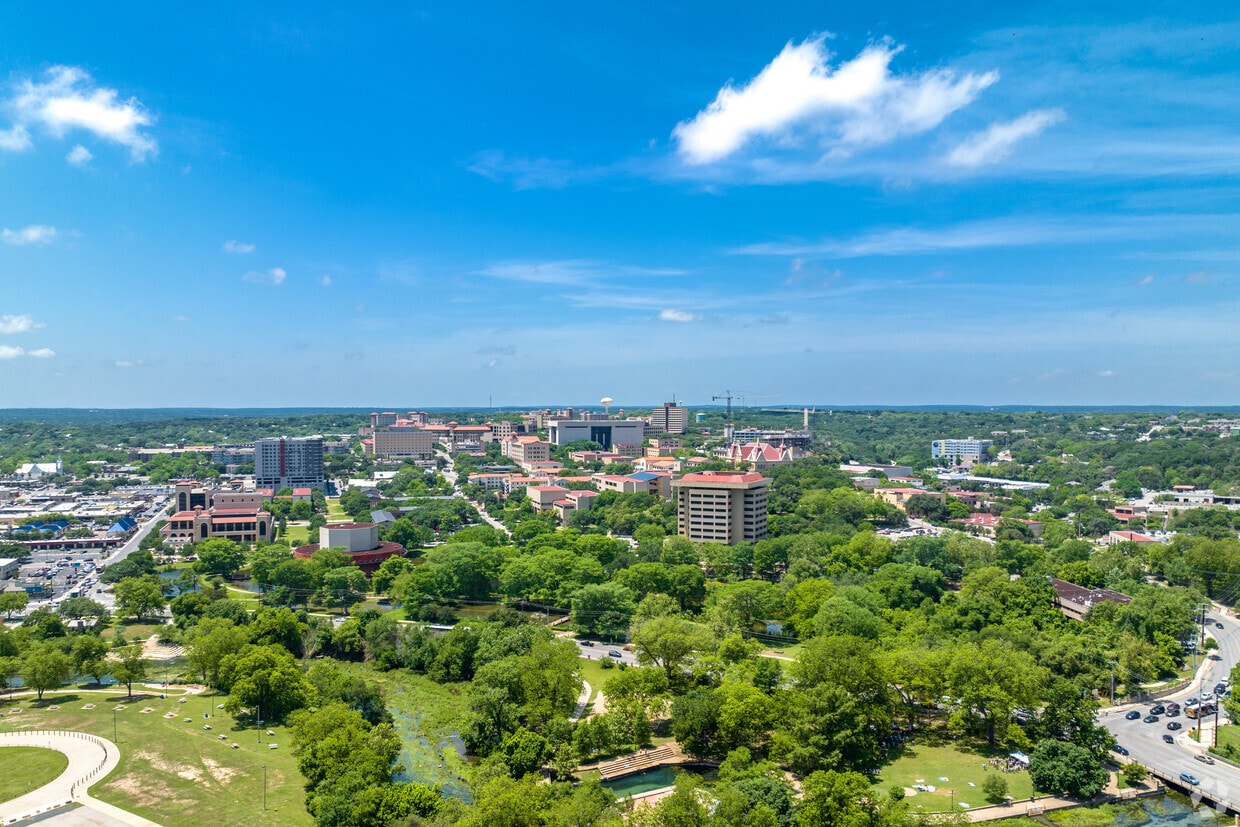
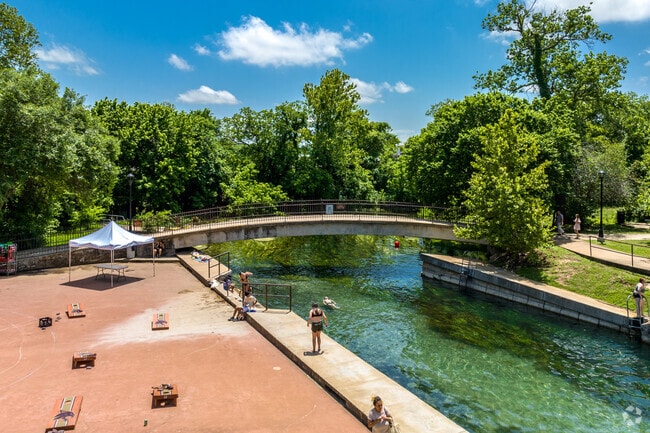
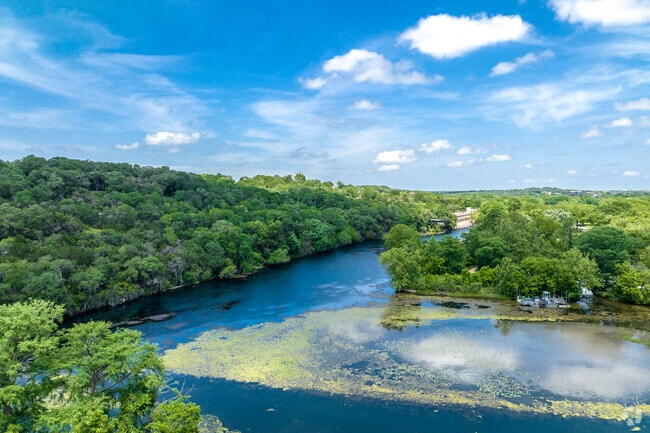
Located between Austin and San Antonio in Central Texas, San Marcos draws renters with its natural beauty and small-town atmosphere. The San Marcos River, maintaining a constant 72-degree temperature throughout the year, offers residents year-round opportunities for swimming, tubing, and kayaking. As home to Texas State University, the city benefits from a dynamic atmosphere and diverse community. Current rental rates range from $868 for studios to $1,882 for four-bedroom units, with most options showing decreased prices over the past year.
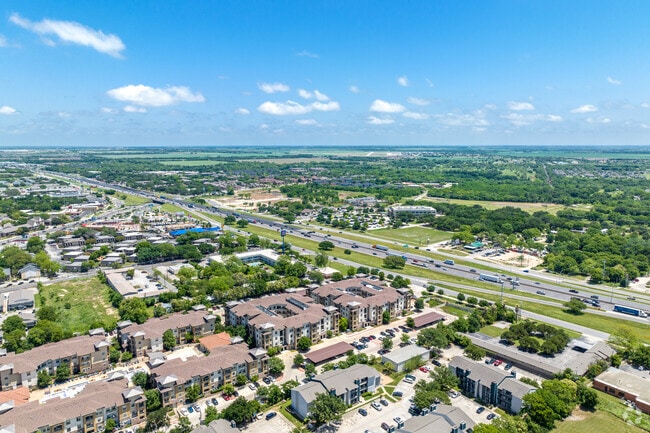
The historic courthouse square anchors downtown San Marcos, where local shops and restaurants create a welcoming atmosphere. Residential options include neighborhoods near downtown, areas surrounding Texas State University, and newer developments along Wonder World Drive and Ranch Road 12. Outdoor enthusiasts enjoy access to Sewell Park and Purgatory Creek Natural Area, featuring miles of hiking trails. The San Marcos Premium Outlets serve as a major shopping destination, while the San Marcos Springs represent one of North America's oldest continuously inhabited locations, with human presence dating back more than 10,000 years.
San Marcos River Next To Sewell Park In The Uptown Neighborhood Of San Marcos, TX.
San Marcos, also called San Marvelous, boasts scenic outdoor views.
As of March 2026, the average apartment rent in San Marcos, TX is $820 for a studio, $1,128 for one bedroom, $1,325 for two bedrooms, and $1,517 for three bedrooms. Apartment rent in San Marcos has decreased by -3.8% in the past year.
The cost of living in San Marcos, TX is 13.8% lower than the national average. Generally, housing in San Marcos is 21.5% less expensive than the national average, with rent falling between $820 - $1,517. You can expect to pay 7.9% less for groceries, 17.1% less for utilities, and 6.2% less for transportation.
Explore how walkable, bikeable, drivable, and transit-friendly San Marcos, TX is for everyday living.
Car-Dependent
This area is considered a car-dependent area and most errands will require a car.
Somewhat Bikeable
You might be able to find places to ride your bike in this area, but you’ll most likely want your car for most errands.
Blanco Vista Elementary School
Public
Grades PK-5

Public
Grades K-5

Public
Grades K-5

Public
Grades K-5
Public
Grades K-5

Public
Grades 6-8

Public
Grades 6-8

Public
Grades K-12

Public
Grades 9-12
Public
Grades K-12

3,490
Communities
959,772
Units
895
Cities

33
Communities
5,458
Units
15
Cities

292
Communities
85,901
Units
169
Cities

81
Communities
12,868
Units
66
Cities

75
Communities
11,163
Units
55
Cities

67
Communities
18,960
Units
33
Cities
† Our analysis of utilities, groceries, transportation, healthcare, home prices, and other goods and services is sourced from the Cost of Living Index, a respected benchmark published by the Council for Community and Economic Research (C2ER) that provides a thorough overview of living expenses across different regions.
Rent data is provided by CoStar Group’s Market Trend reports. As the industry leader in commercial real estate information, analytics, and news, CoStar conducts extensive research to produce and maintain a comprehensive database of commercial real estate information. We combine this data with public record to provide the most up-to-date rental information available.
Consumer goods, services, and home prices are sourced from the Cost of Living Index published by the Council for Community and Economic Research (C2ER). The data on this page is updated quarterly. It was last published in February 2026.


