
Maxwell at Bascom
1350 S Bascom Ave,
San Jose, CA 95128
$3,129 - $6,583 Total Monthly Price
Studio - 2 Beds
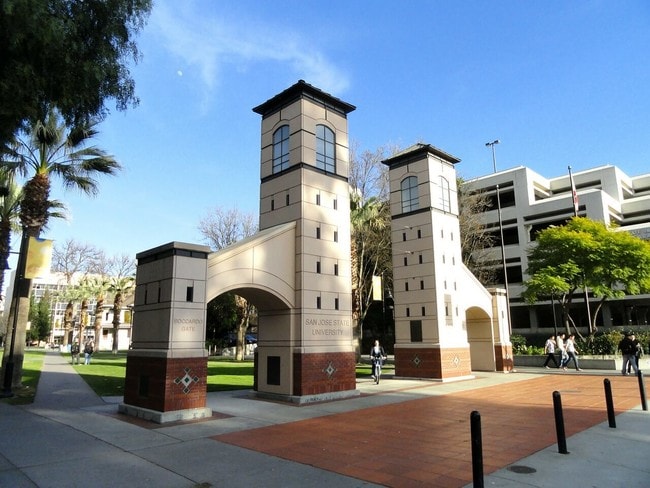
Consistently named among the best places to live in the nation, San Jose is a thriving city at the very heart of America’s tech industry. The highly-walkable downtown is a popular hangout for the entire community, featuring lush parks, exquisite restaurants, performance venues, and a vibrant nightlife scene. Over 30,000 students attend San Jose State University, and the position of the campus right downtown contributes to the college having a major impact on the local culture; the collegiate influence is amplified by the numerous smaller colleges throughout the city as well. The city layout is full of bike lanes, sidewalks, and trails, making the community very walkable and bike-friendly.
San Jose is an excellent city for sports fans, between the San Jose Sharks NHL team, the San Jose Giants baseball team (affiliate to the more famous San Francisco Giants), and the 49ers playing at Levis Stadium in neighboring Santa Clara. The local museums include the San Jose Museum of Art, the Tech Museum of Innovation and the Children’s Discovery Museum of San Jose, all in the downtown core. Guadalupe River Park runs right through the center of town and includes the Heritage Rose Garden, hiking trails and picnic areas.
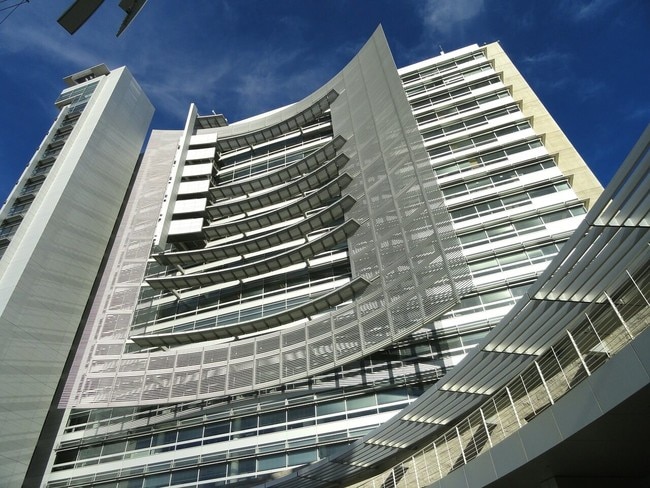
The 18-story tower of San Jose City Hall
The mysterious Winchester Mystery House
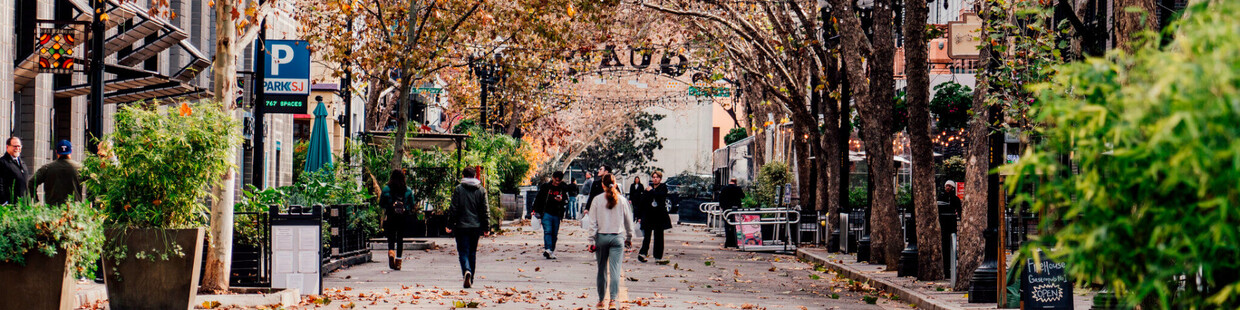
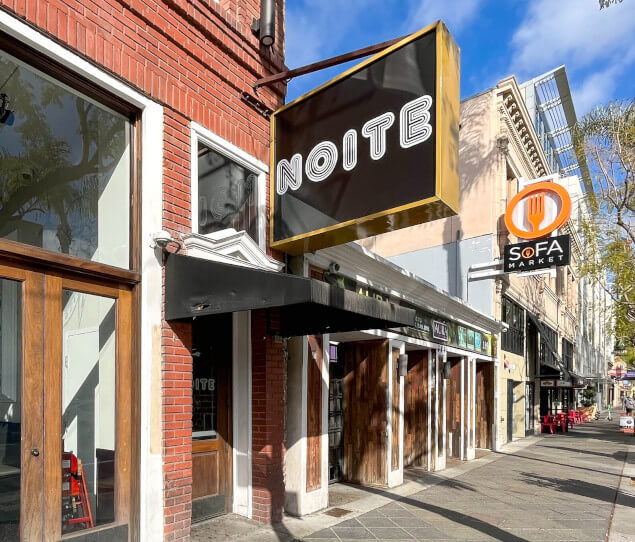
Shops and restaurants in Downtown San Jose
Historic San Pedro Square is home to one of the oldest settlements in California
San Pedro Square contains several popular restaurants
The beautiful and historic St. James Park is a popular downtown destination
As of March 2026, the average apartment rent in San Jose, CA is $2,319 for a studio, $2,693 for one bedroom, $3,378 for two bedrooms, and $4,131 for three bedrooms. Apartment rent in San Jose has increased by 2.8% in the past year.
The cost of living in San Jose, CA is 83.9% higher than the national average. Generally, housing in San Jose is 230.4% more expensive than the national average, with rent falling between $2,320 - $4,128. You can expect to pay 10.4% more for groceries, 42.7% more for utilities, and 36.6% more for transportation.
Explore how walkable, bikeable, drivable, and transit-friendly San Jose, CA is for everyday living.
Somewhat Walkable
You might be able to get out and walk when living in this area. Some errands can be accomplished on foot, but for others you’ll need a car.
Some Transit
You'll likely want a car when living in this area since it has few transit options.
Very Bikeable
This area is very bikeable. You’ll find a variety of bike paths and lanes.
Public
Grades K-8

Hammer Montessori at Galarza Elementary
Public
Grades K-5
Public
Grades K-5

James Franklin Smith Elementary
Public
Grades K-5
Public
Grades K-5
Public
Grades K-8
Public
Grades K-8
Public
Grades 6-8
Public
Grades 6-8
Public
Grades 6-8
Public
Grades 9-12
Public
Grades 9-12
Public
Grades 9-12
Public
Grades 9-12
Public
Grades 9-12

3,491
Communities
958,581
Units
894
Cities

107
Communities
37,535
Units
58
Cities

65
Communities
10,469
Units
32
Cities

36
Communities
11,007
Units
11
Cities

35
Communities
7,724
Units
25
Cities

43
Communities
2,835
Units
15
Cities
† Our analysis of utilities, groceries, transportation, healthcare, home prices, and other goods and services is sourced from the Cost of Living Index, a respected benchmark published by the Council for Community and Economic Research (C2ER) that provides a thorough overview of living expenses across different regions.
Rent data is provided by CoStar Group’s Market Trend reports. As the industry leader in commercial real estate information, analytics, and news, CoStar conducts extensive research to produce and maintain a comprehensive database of commercial real estate information. We combine this data with public record to provide the most up-to-date rental information available.
Consumer goods, services, and home prices are sourced from the Cost of Living Index published by the Council for Community and Economic Research (C2ER). The data on this page is updated quarterly. It was last published in February 2026.


