Budgeting Tips for Renters
Getting ready to rent in San Antonio? Here are some tips for planning your budget.


Area Guide
Avg Rent
$1,074
Population
1,458,570
Renter Mix
48% Rent
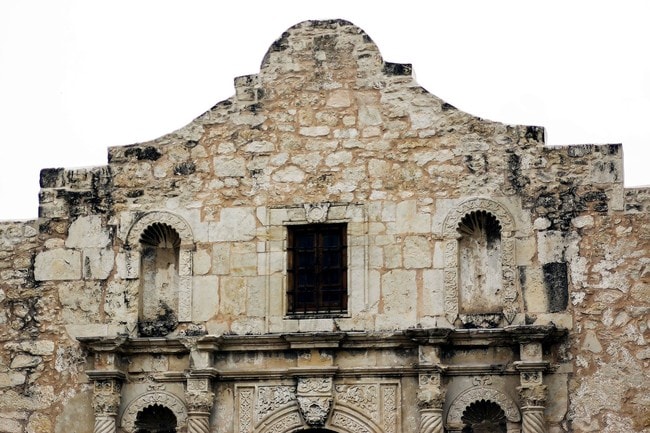
San Antonio blends a rich heritage with modern innovation, resulting in a metropolis teeming with true Texan heart. San Antonio’s distinctive environment reflects centuries of style and a diverse array of culture, which is best exemplified in the La Villita Historic Arts Village. The Alamo may be the most renowned structure in the city, but there are plenty of magnificent historical buildings to see—from the Emily Morgan Hotel to the Meyer Halff House.
Stretched along the San Antonio River is the famous River Walk, where residents and visitors alike can walk or bike from the San Antonio Zoo to the Witte Museum, the historic Majestic Theatre, the Shops at Rivercenter, the Missions of San Antonio and back again.
The city and the surrounding region offer endless opportunities for exploration. Should you choose to rent an apartment in San Antonio, you will have the opportunity to hike the rugged trails of the Government Canyon State Natural Area, see the San Antonio Spurs play at the Alamodome, peruse the Historic Market Square, and enjoy the thrills of Six Flags Fiesta Texas. Convenient to the San Antonio International Airport and major highways, San Antonio affords residents simple commutes and travels.
The Alamo
Historic Emily Morgan Hotel
1893 Meyer Halff House
Mission San Jose
San Antonio Skyline
Shopping in San Antonio
Median Household Income
$56,185
Average: $75,511
Education
352,908
Residents Have a Degree
Job Market
715,767
Workers Employed
Median Age
36 Years
Largest Age Group
25-34 Years
Approximately 16% of Residents
Under 20
26%
Over 65
14%
Housing Distribution
San Antonio has more homeowners than renters.

Education Distribution
Review this city's overall education levels.

As of June 2026, the average apartment rent in San Antonio, TX is $911 for a studio, $1,074 for one bedroom, $1,373 for two bedrooms, and $1,804 for three bedrooms. Apartment rent in San Antonio has decreased by -3.7% in the past year.
The cost of living in San Antonio, TX is 8.7% lower than the national average. Generally, housing in San Antonio is 24.8% less expensive than the national average, with rent falling between $911 - $1,804. You can expect to pay 6.9% less for groceries, 15.2% less for utilities, and 7.9% less for transportation.
Compare Cities

Budgeting Tips for Renters
Getting ready to rent in San Antonio? Here are some tips for planning your budget.
How to Choose an Apartment Community You'll Love
There are so many great apartments out there! Here's how to find one that fits you best.

10 Most Affordable Neighborhoods in San Antonio
These San Antonio neighborhoods are great for you and your budget!
Explore how walkable, bikeable, drivable, and transit-friendly San Antonio, TX is for everyday living.
Fairly Walkable
Walkability
Limited Public Transit
Transit
Exceptionally Drivable
Drivability
Fairly Bikeable
Bikeability
BASIS San Antonio Primary- Medical Center Campus
Public
Grades K-5
787 Students

Timberwood Park Elementary School
Public
Grades PK-5
765 Students
Public
Grades PK-5
861 Students

Public
Grades PK-5
849 Students
Cibolo Green Elementary School
Public
Grades PK-5
834 Students
BASIS San Antonio- Shavano Campus
Public
Grades 6-12
1,018 Students
Public
Grades 6-8
1,583 Students
Public
Grades 6-8
1,361 Students
Public
Grades 6-8
1,361 Students
Robert G Cole Middle/High School
Public
Grades 6-12
777 Students
BASIS San Antonio- Shavano Campus
Public
Grades 6-12
1,018 Students
Robert G Cole Middle/High School
Public
Grades 6-12
777 Students
Young Women's Leadership Academy
Public
Grades 6-12
528 Students
Public
Grades 9-12
3,397 Students

Public
Grades 9-12
3,202 Students
† Our analysis of utilities, groceries, transportation, healthcare, home prices, and other goods and services is sourced from the Cost of Living Index, a respected benchmark published by the Council for Community and Economic Research (C2ER) that provides a thorough overview of living expenses across different regions.
Rent data is provided by CoStar Group’s Market Trend reports. As the industry leader in commercial real estate information, analytics, and news, CoStar conducts extensive research to produce and maintain a comprehensive database of commercial real estate information. We combine this data with public record to provide the most up-to-date rental information available.
Consumer goods, services, and home prices are sourced from the Cost of Living Index published by the Council for Community and Economic Research (C2ER). The data on this page is updated quarterly. It was last published in June 2026.
Demographic information comes from Neustar and combines detailed address data with U.S. Census and American Community Survey statistics to produce reliable local estimates.


