
Eastpark Apartment Homes
102 Greencrest St NE,
Salem, OR 97301
$1,378 - $2,182
Studio - 3 Beds

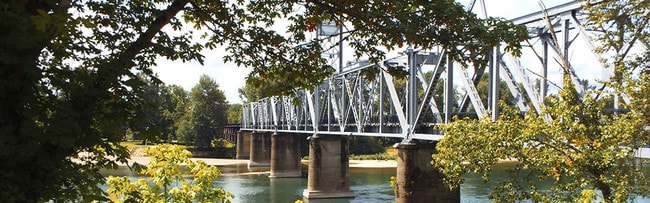


Welcome to Salem, Oregon's capital city nestled in the heart of the Willamette Valley. Home to 179,331 residents, Salem combines historic architecture with contemporary living. The rental market remains stable, with one-bedroom apartments averaging $1,197, reflecting a 2% annual increase. Notable areas include the State Capitol district and West Salem across the Willamette River. The city's parks system features the 1,200-acre Minto-Brown Island Park and Bush's Pasture Park, while Willamette University adds to the community's educational landscape.
Salem embraces its heritage as the "Cherry City," celebrating its agricultural roots through community gatherings like the Salem Saturday Market. The downtown area features the historic Elsinore Theatre and its preserved pipe organ, while the Hallie Ford Museum of Art showcases regional artists. The Riverfront Carousel stands as a beloved local landmark. Housing options span from downtown apartments to residential developments in South Salem and Northeast Salem. The Capitol Mall area continues to add new housing while maintaining easy access to the city's parks and amenities.
The Oregon State Capitol Building in Salem
Enjoy amazing hikes near Salem
As of March 2026, the average apartment rent in Salem, OR is $1,253 for a studio, $1,203 for one bedroom, $1,400 for two bedrooms, and $1,864 for three bedrooms. Apartment rent in Salem has increased by 0.1% in the past year.
Explore how walkable, bikeable, drivable, and transit-friendly Salem, OR is for everyday living.
Somewhat Walkable
You might be able to get out and walk when living in this area. Some errands can be accomplished on foot, but for others you’ll need a car.
Some Transit
You'll likely want a car when living in this area since it has few transit options.
Very Bikeable
This area is very bikeable. You’ll find a variety of bike paths and lanes.
Public
Grades K-5

Public
Grades K-5

Public
Grades K-5
Public
Grades K-5

Brush College Elementary School
Public
Grades K-5
Public
Grades 6-8
Jane Goodall Environmental Middle Charter School
Public
Grades 6-8

Public
Grades K-8

Public
Grades 6-8
Public
Grades 6-8
Public
Grades 9-12
Public
Grades 9-12
Public
Grades 9-12
Public
Grades 9-12

Public
Grades 9-12

56
Communities
4,782
Units
23
Cities

21
Communities
1,434
Units
7
Cities
10
Communities
474
Units
2
Cities

10
Communities
728
Units
4
Cities

73
Communities
3,723
Units
34
Cities

11
Communities
1,564
Units
5
Cities
† Our analysis of utilities, groceries, transportation, healthcare, home prices, and other goods and services is sourced from the Cost of Living Index, a respected benchmark published by the Council for Community and Economic Research (C2ER) that provides a thorough overview of living expenses across different regions.
Rent data is provided by CoStar Group’s Market Trend reports. As the industry leader in commercial real estate information, analytics, and news, CoStar conducts extensive research to produce and maintain a comprehensive database of commercial real estate information. We combine this data with public record to provide the most up-to-date rental information available.
Consumer goods, services, and home prices are sourced from the Cost of Living Index published by the Council for Community and Economic Research (C2ER). The data on this page is updated quarterly. It was last published in February 2026.


