Median Age
52 Years
Largest Age Group
60-69 Years
Approximately 17% of Residents
Under 20
18%
Over 65
30%
Avg Rent
$1,512
Population
15,621
Renter Mix
19% Rent
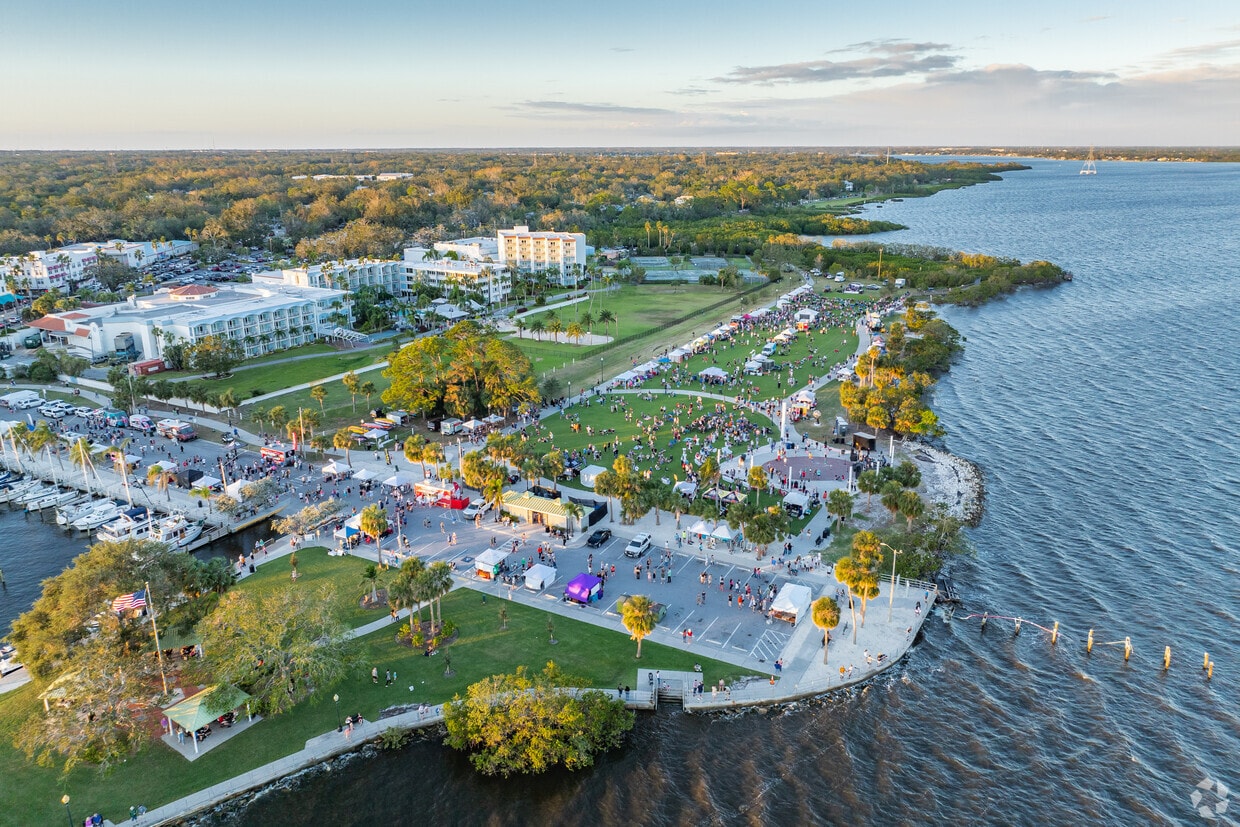
Tucked along the western shore of Tampa Bay, Safety Harbor carries centuries of history beneath its canopy-lined streets. Downtown Main Street hums with independent boutiques, local eateries, and live music from the Safety Harbor Art and Music Center. Philippe Park showcases the largest remaining Tocobaga temple mound in the region—a relic dating back thousands of years. The Safety Harbor Resort and Spa, built over natural mineral springs once rumored to be Hernando de Soto's Fountain of Youth, remains one of Pinellas County's most storied destinations.
The rental landscape is cozy by design in this six-square-mile city. Low-rise apartment communities, townhomes, and garden-style rentals complement the relaxed pace. With Clearwater just miles south and Tampa International Airport under ten miles away, Safety Harbor offers excellent connectivity without big-city buzz. Whether casting a line off the fishing pier or browsing weekend markets downtown, life here moves at an intentional pace.
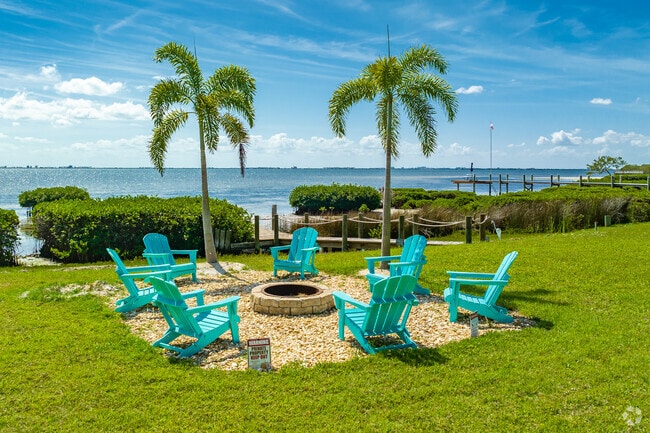
A beautiful private fire pit area overlooks the bay in Safety Harbor.
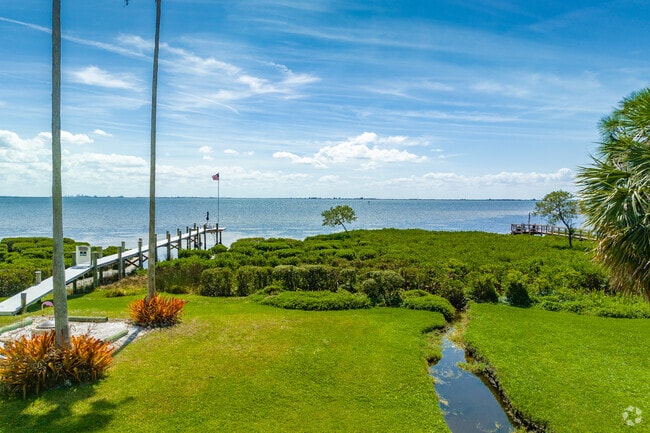
Take in the view of Old Tampa Bay from your front porch in Greater Safety Harbor South, FL.
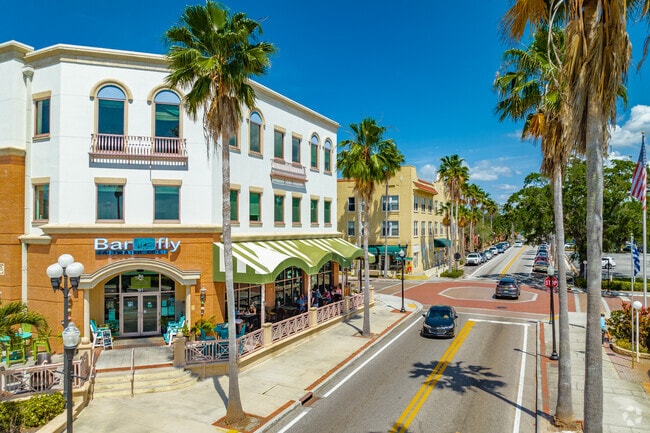
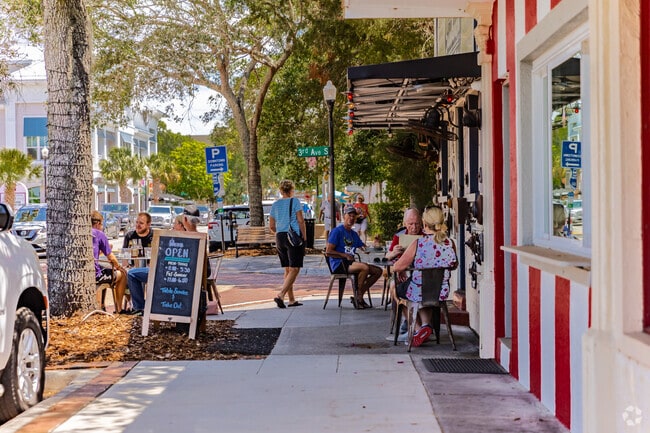
People take advantage of the great weather at this local eatery in Greater Safety Harbor South.
The Water Oak Grill features a happy hour special that many locals enjoy in Safety Harbor, FL.
Safety Harbor welcomes boaters to fish in M
Safety Harbor has some spectacular houses in spectacular locations.
Median Household Income
$96,118
Average: $118,668
Education
5,942
Residents Have a Degree
Job Market
8,220
Workers Employed
Median Age
52 Years
Largest Age Group
60-69 Years
Approximately 17% of Residents
Under 20
18%
Over 65
30%
Housing Distribution
Safety Harbor has more homeowners than renters.

Education Distribution
Review this city's overall education levels.

As of July 2026, the average apartment rent in Safety Harbor, FL is $1,520 for one bedroom, and $1,762 for two bedrooms. Apartment rent in Safety Harbor has increased by 3.9% in the past year.
Explore how walkable, bikeable, drivable, and transit-friendly Safety Harbor, FL is for everyday living.
Fairly Walkable
Walkability
Very Drivable
Drivability
Fairly Bikeable
Bikeability
Safety Harbor Elementary School
Public
Grades PK-5
582 Students

Public
Grades 6-8
845 Students

† Our analysis of utilities, groceries, transportation, healthcare, home prices, and other goods and services is sourced from the Cost of Living Index, a respected benchmark published by the Council for Community and Economic Research (C2ER) that provides a thorough overview of living expenses across different regions.
Rent data is provided by CoStar Group’s Market Trend reports. As the industry leader in commercial real estate information, analytics, and news, CoStar conducts extensive research to produce and maintain a comprehensive database of commercial real estate information. We combine this data with public record to provide the most up-to-date rental information available.
Consumer goods, services, and home prices are sourced from the Cost of Living Index published by the Council for Community and Economic Research (C2ER). The data on this page is updated quarterly. It was last published in June 2026.
Demographic information comes from Neustar and combines detailed address data with U.S. Census and American Community Survey statistics to produce reliable local estimates.


