
Oasis at Round Rock
8030 County Road 110,
Round Rock, TX 78665
$2,241 - $3,140 Total Monthly Price
1-3 Beds


Welcome to Round Rock, Texas, located 20 miles north of Austin. With nearly 120,000 residents, Round Rock offers diverse housing options throughout neighborhoods like La Frontera and Old Town. The rental market presents various opportunities, with average rents ranging from $1,251 for one-bedroom units to $2,113 for three-bedroom homes. While rental rates have decreased by 7.4%, Round Rock continues to attract residents with its amenities and highly rated schools.
Round Rock's community spaces include Old Settlers Park, home to the Rockin' River Family Aquatic Center and multiple sports facilities. Baseball fans enjoy games at Dell Diamond, where the Round Rock Express Triple-A team plays. Downtown Round Rock preserves local history, including the landmark round rock in Brushy Creek that marked the historic Chisholm Trail crossing. Dell Technologies' headquarters employs approximately 16,000 people, contributing to the area's economic growth. The Round Rock Higher Education Center houses campuses for Texas State University, Austin Community College, and Temple College. With easy access to Interstate 35 and a growing medical district featuring several hospitals, Round Rock offers convenient access to employment, healthcare, and education.
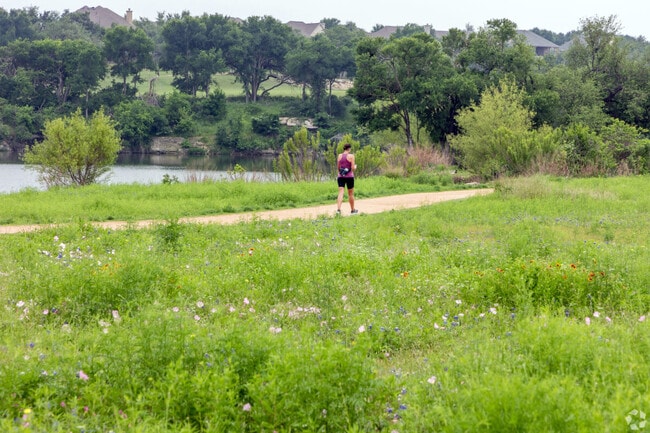
Brushy Creek offers scenic trails, parks, and outdoor activities in Round Rock.
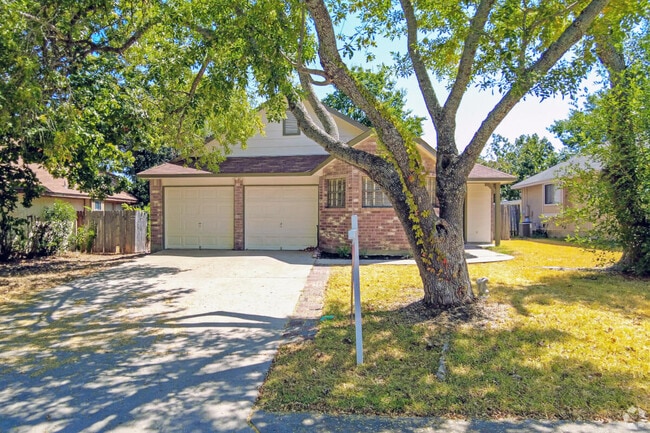
Most homes in Stony Point have large, matured oak trees that provide shade on warm days.
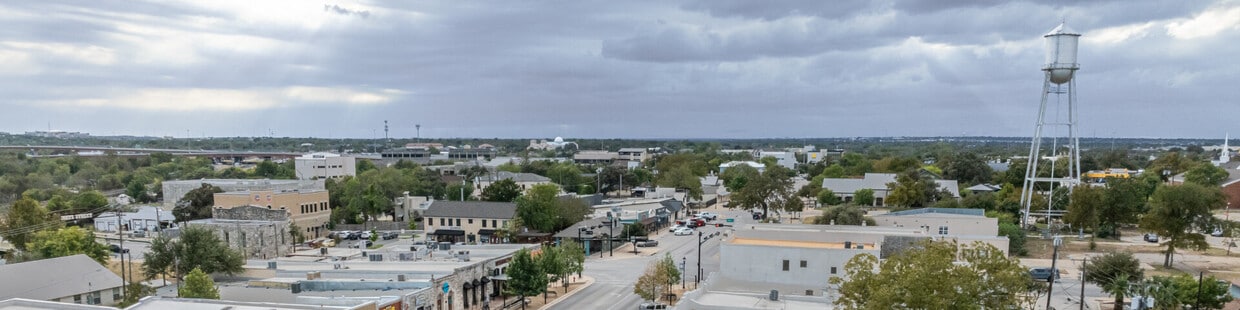
The Round Rock water tower is visible throughout downtown.
As of March 2026, the average apartment rent in Round Rock, TX is $1,037 for a studio, $1,173 for one bedroom, $1,501 for two bedrooms, and $1,952 for three bedrooms. Apartment rent in Round Rock has decreased by -6.7% in the past year.
The cost of living in Round Rock, TX is 7.1% lower than the national average. Generally, housing in Round Rock is 7.8% less expensive than the national average, with rent falling between $1,037 - $1,952. You can expect to pay 14.4% less for groceries, 8.9% more for utilities, and 15.2% less for transportation.
Explore how walkable, bikeable, drivable, and transit-friendly Round Rock, TX is for everyday living.
Car-Dependent
This area is considered a car-dependent area and most errands will require a car.
Minimal Transit
You'll likely want a car when living in this area since it has few transit options.
Somewhat Bikeable
You might be able to find places to ride your bike in this area, but you’ll most likely want your car for most errands.
Chandler Oaks Elementary School
Public
Grades PK-5

Cactus Ranch Elementary School
Public
Grades PK-5
Linda Herrington Elementary School
Public
Grades PK-5
Public
Grades PK-5

Public
Grades PK-5
IDEA Round Rock Tech College Preparatory
Public
Grades 6-8
Public
Grades 6-8
Public
Grades K-12
Public
Grades 6-8
Public
Grades 6-8

Public
Grades K-12
Public
Grades 9-12
RRISD Early College High School
Public
Grades 9-12
Public
Grades 9-12

Public
Grades 9-12


3,490
Communities
959,772
Units
895
Cities

715
Communities
198,674
Units
340
Cities

103
Communities
35,140
Units
62
Cities

16
Communities
2,654
Units
2
Cities

457
Communities
108,184
Units
229
Cities

555
Communities
124,459
Units
221
Cities
† Our analysis of utilities, groceries, transportation, healthcare, home prices, and other goods and services is sourced from the Cost of Living Index, a respected benchmark published by the Council for Community and Economic Research (C2ER) that provides a thorough overview of living expenses across different regions.
Rent data is provided by CoStar Group’s Market Trend reports. As the industry leader in commercial real estate information, analytics, and news, CoStar conducts extensive research to produce and maintain a comprehensive database of commercial real estate information. We combine this data with public record to provide the most up-to-date rental information available.
Consumer goods, services, and home prices are sourced from the Cost of Living Index published by the Council for Community and Economic Research (C2ER). The data on this page is updated quarterly. It was last published in February 2026.


