Median Age
41 Years
Largest Age Group
40-49 Years
Approximately 15% of Residents
Under 20
24%
Over 65
19%


Area Guide
Avg Rent
$1,416
Population
113,217
Renter Mix
19% Rent
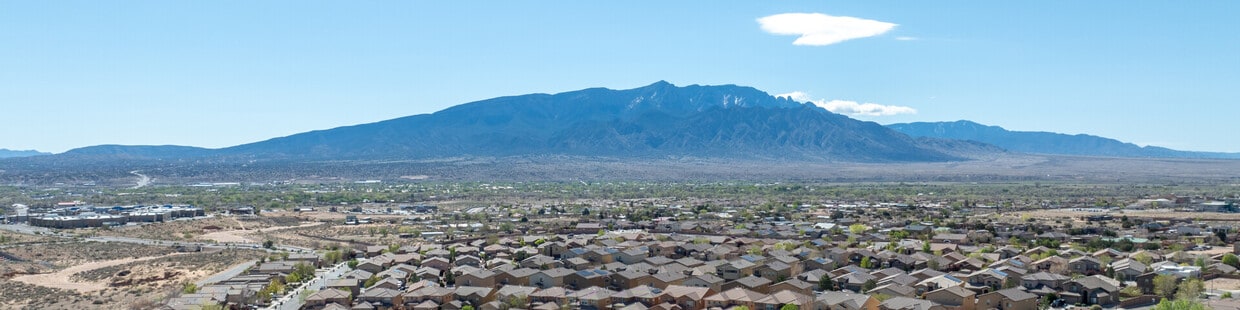
An affordable location with a variety of rental opportunities, Rio Rancho is a blend of suburb and open desert. Just 16 miles north of Albuquerque, Rio Ranch resides in the heart of New Mexico. Kid-friendly amenities are abundant in town like A Park Above. This accessible park is the best place for children in the area with large playgrounds, splash pad, and community events.
Rio Rancho Public Schools offers Stapleton Elementary, Rio Ranch Middle, Rio Ranch High School and more. Rio Rancho’s open desert provides breathtaking landscapes and outdoor adventures year-round. Enjoy easy access to major highways and delicious restaurants like Filiberto’s Mexican Food, Cazuela’s Mexican Grill and Brewery, and Turtle Mountain Brewing Company.
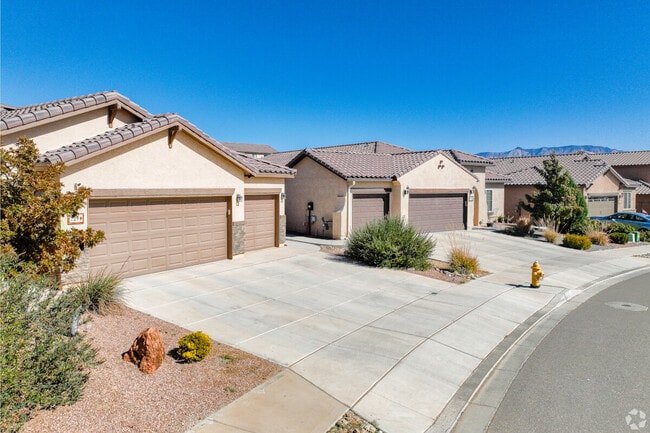
One of the many styles found around Rio Rancho is the Spanish Revival with the tiled roof.
Residents of Rio Rancho have many options to choose from for hiking.
The Block features many food options that brings a big variety of choices to Rio Rancho.
Median Household Income
$75,540
Average: $94,554
Education
29,406
Residents Have a Degree
Job Market
54,849
Workers Employed
Median Age
41 Years
Largest Age Group
40-49 Years
Approximately 15% of Residents
Under 20
24%
Over 65
19%
Housing Distribution
Rio Rancho has more homeowners than renters.

Education Distribution
Review this city's overall education levels.

As of June 2026, the average apartment rent in Rio Rancho, NM is $1,118 for a studio, $1,413 for one bedroom, $1,693 for two bedrooms, and $2,122 for three bedrooms. Apartment rent in Rio Rancho has increased by 0.3% in the past year.
The cost of living in Rio Rancho, NM is 8.4% lower than the national average. Generally, housing in Rio Rancho is 10.9% less expensive than the national average, with rent falling between $1,118 - $2,122. You can expect to pay 3.5% less for groceries, 16.1% less for utilities, and 7.6% less for transportation.
Compare Cities
Explore how walkable, bikeable, drivable, and transit-friendly Rio Rancho, NM is for everyday living.
Somewhat Walkable
Walkability
Very Drivable
Drivability
Somewhat Bikeable
Bikeability
Sandoval Academy of Bilingual Education
Public
Grades K-8
228 Students

Ernest Stapleton Elementary School
Public
Grades K-5
815 Students

Public
Grades K-5
815 Students
Public
Grades K-5
768 Students
Vista Grande Elementary School
Public
Grades K-5
768 Students
Public
Grades 6-12
205 Students

Sandoval Academy of Bilingual Education
Public
Grades K-8
228 Students
Public
Grades 6-8
937 Students

Public
Grades 6-8
937 Students
Public
Grades 6-8
1,143 Students
Public
Grades 6-12
205 Students
Public
Grades 9-12
2,631 Students
Public
Grades 9-12
2,573 Students
Public
Grades 9-12
2,573 Students
Public
Grades 6-12
625 Students

† Our analysis of utilities, groceries, transportation, healthcare, home prices, and other goods and services is sourced from the Cost of Living Index, a respected benchmark published by the Council for Community and Economic Research (C2ER) that provides a thorough overview of living expenses across different regions.
Rent data is provided by CoStar Group’s Market Trend reports. As the industry leader in commercial real estate information, analytics, and news, CoStar conducts extensive research to produce and maintain a comprehensive database of commercial real estate information. We combine this data with public record to provide the most up-to-date rental information available.
Consumer goods, services, and home prices are sourced from the Cost of Living Index published by the Council for Community and Economic Research (C2ER). The data on this page is updated quarterly. It was last published in June 2026.
Demographic information comes from Neustar and combines detailed address data with U.S. Census and American Community Survey statistics to produce reliable local estimates.


