5 Most Affordable Neighborhoods in Portland, OR
Searching for Portland housing on a budget? Explore the most affordable neighborhoods in the city with this in-depth guide.

Area Guide
Avg Rent
$1,523
Population
631,775
Renter Mix
52% Rent
Portland sits where the Willamette and Columbia rivers meet, tucked between mountain ranges with more than 10,000 acres of protected parkland woven into the city's fabric. Washington Park alone offers 15 miles of hiking paths, the Oregon Zoo, and the Portland Japanese Garden. The city's MAX light rail, Portland Streetcar, and extensive bike lane network make getting around effortless, and Powell's City of Books on Burnside has anchored the local literary scene for decades.
Renters here have no shortage of options, from sleek high-rise apartments in South Waterfront to Craftsman-style townhomes in Irvington and industrial lofts throughout Central Eastside. Neighborhoods like the Pearl District, Hawthorne, and Sellwood-Moreland each carry their own personality — from converted warehouse lofts and gallery rows to vintage shops and riverfront trails.
Portland State University keeps the city energized, bringing a creative pulse to the downtown area. The city earned its nickname "the Rose City" through the International Rose Test Garden, which has been blooming in Washington Park since 1917 and remains one of the oldest operating public rose test gardens in the country.
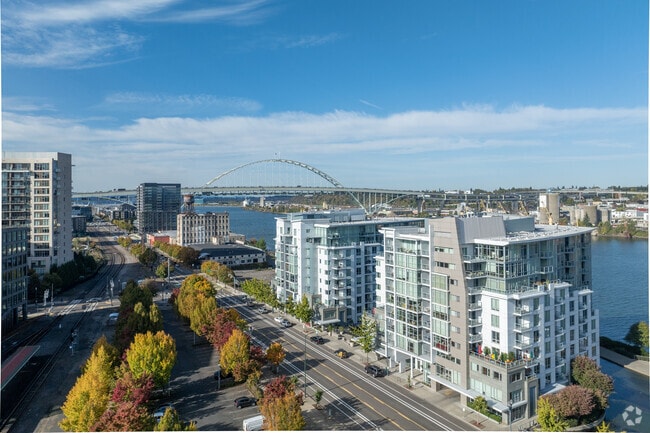
The city of Portland features stunning new condos on the waterfront.
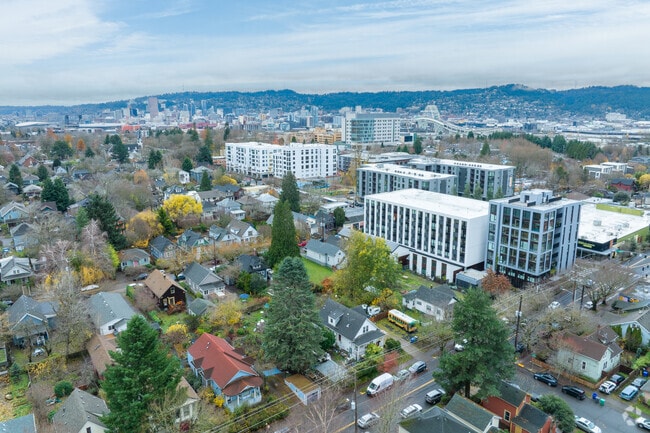
Highway 99 creates a dividing line between most homes and the retail district in North Eliot.
The Pearl District in downtown Portland has a light rail system.
The Pearl District in downtown Portland has a light rail system.
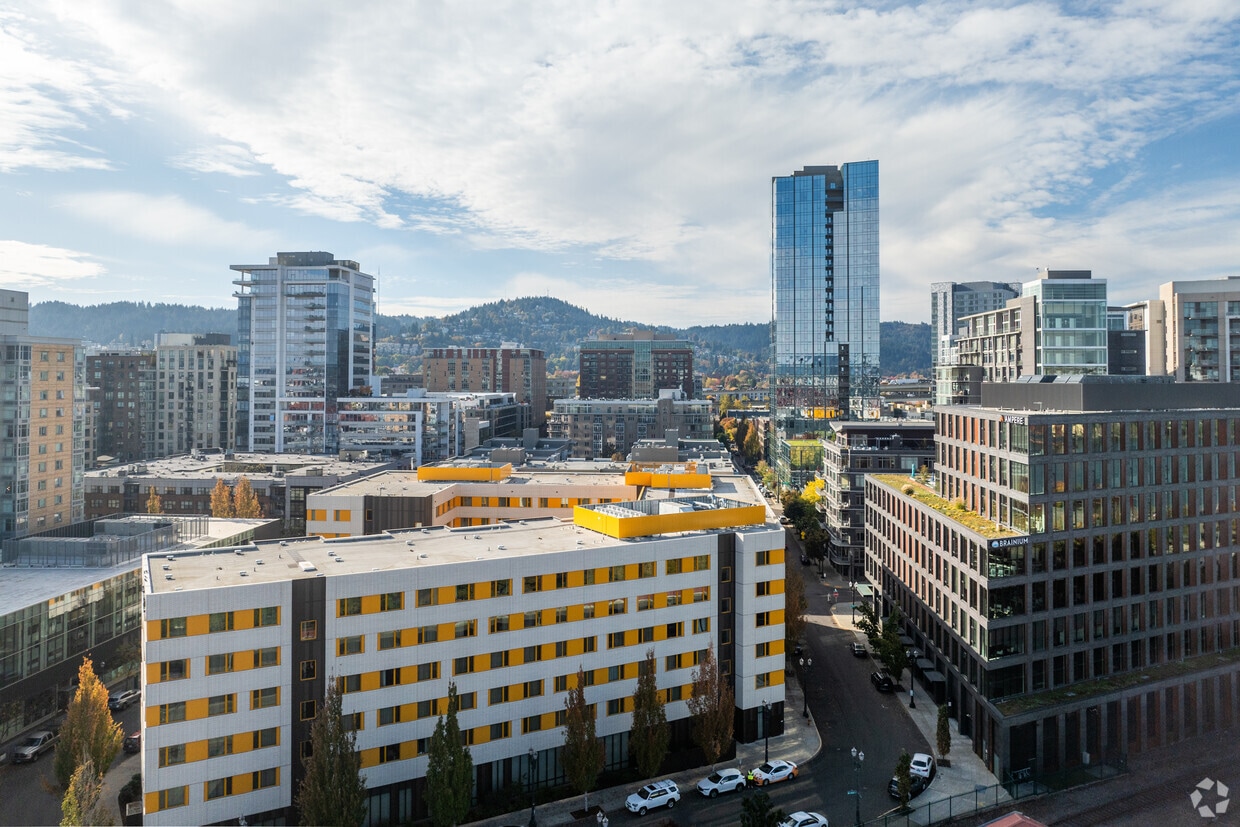
Downtown Portland offers condos with stunning water views.
Downtown Portland offers condos with stunning water views.
Median Household Income
$83,502
Average: $109,599
Education
284,864
Residents Have a Degree
Job Market
361,459
Workers Employed
Median Age
40 Years
Largest Age Group
30-39 Years
Approximately 18% of Residents
Under 20
19%
Over 65
16%
Housing Distribution
Portland has more renters than homeowners.

Education Distribution
Review this city's overall education levels.

As of June 2026, the average apartment rent in Portland, OR is $1,252 for a studio, $1,523 for one bedroom, $1,812 for two bedrooms, and $2,111 for three bedrooms. Apartment rent in Portland has decreased by -0.6% in the past year.
The cost of living in Portland, OR is 15.4% higher than the national average. Generally, housing in Portland is 33.3% more expensive than the national average, with rent falling between $1,252 - $2,111. You can expect to pay 7.6% more for groceries, 1.7% less for utilities, and 24.1% more for transportation.
Compare Cities

5 Most Affordable Neighborhoods in Portland, OR
Searching for Portland housing on a budget? Explore the most affordable neighborhoods in the city with this in-depth guide.
10 Things to Know Before Moving to Portland, OR
Before you start enjoying Portland's food carts, forests, and famously quirky vibe, here are 10 things you need to know.

Best Neighborhoods in Portland, OR for Renters
Don't know where to start your Portland rental search? Here are five Portland neighborhoods perfect for renters.

Top 10 Most Dog-Friendly Neighborhoods in Portland, OR
Discover the top 10 dog-friendly neighborhoods in Portland, OR. Explore parks, trails, and pet-friendly apartments perfect for you and your furry friend.
Explore how walkable, bikeable, drivable, and transit-friendly Portland, OR is for everyday living.
Exceptionally Walkable
Walkability
Some Public Transit
Transit
Fairly Drivable
Drivability
Very Bikeable
Bikeability
Public
Grades K-5
538 Students

Public
Grades K-5
467 Students
Public
Grades K-5
353 Students
Public
Grades K-5
337 Students
Public
Grades K-5
320 Students
Public
Grades 6-8
606 Students
Public
Grades 6-8
446 Students
Public
Grades 6-8
998 Students

Public
Grades K-8
764 Students
Public
Grades K-8
674 Students
Public
Grades 9-12
2,156 Students
Public
Grades 9-12
1,962 Students
Public
Grades 9-12
185 Students
Ida B. Wells-Barnett High School
Public
Grades 9-12
1,556 Students

Public
Grades 9-12
1,525 Students
† Our analysis of utilities, groceries, transportation, healthcare, home prices, and other goods and services is sourced from the Cost of Living Index, a respected benchmark published by the Council for Community and Economic Research (C2ER) that provides a thorough overview of living expenses across different regions.
Rent data is provided by CoStar Group’s Market Trend reports. As the industry leader in commercial real estate information, analytics, and news, CoStar conducts extensive research to produce and maintain a comprehensive database of commercial real estate information. We combine this data with public record to provide the most up-to-date rental information available.
Consumer goods, services, and home prices are sourced from the Cost of Living Index published by the Council for Community and Economic Research (C2ER). The data on this page is updated quarterly. It was last published in June 2026.
Demographic information comes from Neustar and combines detailed address data with U.S. Census and American Community Survey statistics to produce reliable local estimates.


