Median Age
39 Years
Largest Age Group
30-39 Years
Approximately 15% of Residents
Under 20
23%
Over 65
19%


Avg Rent
$1,689
Population
18,500
Renter Mix
36% Rent
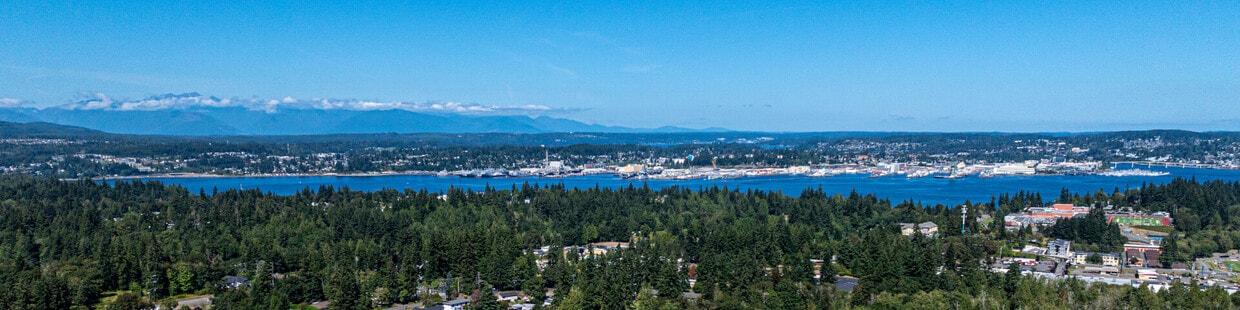
Port Orchard is a waterfront community on the Kitsap Peninsula. Located between the bustling city of Seattle and the lush Olympic National Park, Port Orchard offers residents access to both metropolitan and natural amenities. Port Orchard borders the Puget Sound, providing abundant opportunities for boating and water sports, stunning waterfront views, and ferry access to Seattle.
Port Orchard’s walkable downtown area also stretches along the waterfront, featuring lines of unique shops, antique stores, and tasty restaurants. The tight-knit community in Port Orchard enjoys a small-town atmosphere with a variety of local events such as First Friday Artwalks, the Festival of Chimes and Lights, Pooch and Purr Pet Parade, and summertime concerts. Convenience to Route 16 and Washington State Ferries allows for simple commutes and travels from Port Orchard.
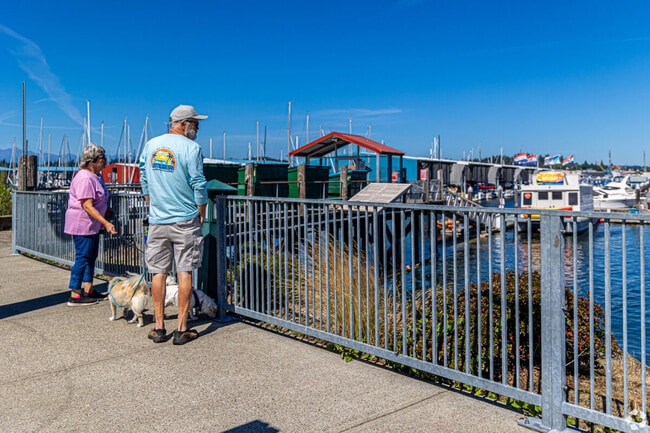
Sunny days in the McCormick Woods neighborhood can be spent by the water.
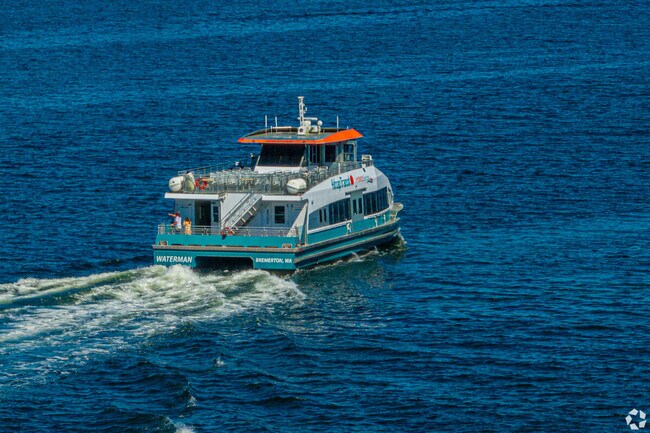
The Port Orchard Foot Ferry runs a regular schedule every day to Bremerton.
South Kitsap Regional Park is a major recreational park in Port Orchard.
Median Household Income
$81,072
Average: $99,819
Education
5,001
Residents Have a Degree
Job Market
7,807
Workers Employed
Median Age
39 Years
Largest Age Group
30-39 Years
Approximately 15% of Residents
Under 20
23%
Over 65
19%
Housing Distribution
Port Orchard has more homeowners than renters.

Education Distribution
Review this city's overall education levels.

As of July 2026, the average apartment rent in Port Orchard, WA is $1,648 for a studio, $1,689 for one bedroom, $1,979 for two bedrooms, and $2,305 for three bedrooms. Apartment rent in Port Orchard has increased by 3.6% in the past year.
The cost of living in Port Orchard, WA is 16.1% higher than the national average. Generally, housing in Port Orchard is 13.8% more expensive than the national average, with rent falling between $1,648 - $2,305. You can expect to pay 11.2% more for groceries, 5.7% more for utilities, and 26.5% more for transportation.
Compare Cities
Explore how walkable, bikeable, drivable, and transit-friendly Port Orchard, WA is for everyday living.
Somewhat Walkable
Walkability
Limited Public Transit
Transit
Exceptionally Drivable
Drivability
Fairly Bikeable
Bikeability
Public
Grades PK-5
325 Students

Public
Grades PK-5
549 Students

Orchard Heights Elementary School
Public
Grades PK-5
549 Students
Public
Grades PK-5
437 Students
Public
Grades PK-5
541 Students

John Sedgwick Junior High School
Public
Grades 6-8
738 Students
Cedar Heights Junior High School
Public
Grades 6-8
731 Students
Marcus Whitman Junior High School
Public
Grades 6-8
686 Students

Public
Grades K-12
265 Students
Public
Grades 9-12
2,389 Students
Public
Grades K-12
265 Students
Public
Grades 9-12
205 Students

† Our analysis of utilities, groceries, transportation, healthcare, home prices, and other goods and services is sourced from the Cost of Living Index, a respected benchmark published by the Council for Community and Economic Research (C2ER) that provides a thorough overview of living expenses across different regions.
Rent data is provided by CoStar Group’s Market Trend reports. As the industry leader in commercial real estate information, analytics, and news, CoStar conducts extensive research to produce and maintain a comprehensive database of commercial real estate information. We combine this data with public record to provide the most up-to-date rental information available.
Consumer goods, services, and home prices are sourced from the Cost of Living Index published by the Council for Community and Economic Research (C2ER). The data on this page is updated quarterly. It was last published in June 2026.
Demographic information comes from Neustar and combines detailed address data with U.S. Census and American Community Survey statistics to produce reliable local estimates.


