
Panorama Riverpark
2700 N Ventura Rd,
Oxnard, CA 93036
$2,430 - $4,983
Studio - 3 Beds

Welcome to Oxnard, where Pacific breezes meet agricultural heritage along the California coast. This seaside city offers renters a range of housing options, with current rental rates averaging $2,133 for a one-bedroom apartment, showing a 4.5% increase over last year. From beachfront properties in Oxnard Shores to established neighborhoods near Heritage Square, residents find diverse living arrangements throughout the community. Channel Islands Harbor serves as a centerpiece for waterfront activities, while downtown's Heritage Square preserves Victorian-era architecture that tells the story of Oxnard's past.
Oxnard combines outdoor recreation with cultural attractions. The city's seven miles of beaches provide opportunities for surfing, swimming, and sunbathing, while the Channel Islands Maritime Museum offers insights into the region's nautical history. The area's agricultural roots remain strong, with strawberry fields dotting the landscape and the annual California Strawberry Festival drawing visitors from across the state. Housing options include apartment communities near The Collection at RiverPark, beachside rentals in Oxnard Shores, and historic properties in the Henry T. Oxnard Historic District. The Mediterranean climate, with average temperatures of 61°F, creates ideal conditions for year-round outdoor activities, whether at the beach, local parks, or along harbor walking paths.
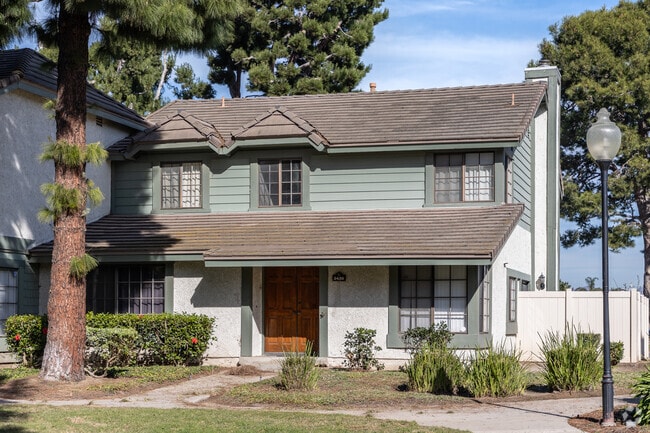
Silverado Townhomes has well appointed residences in College Park Oxnard.
Silverado Townhomes has well appointed residences in College Park Oxnard.
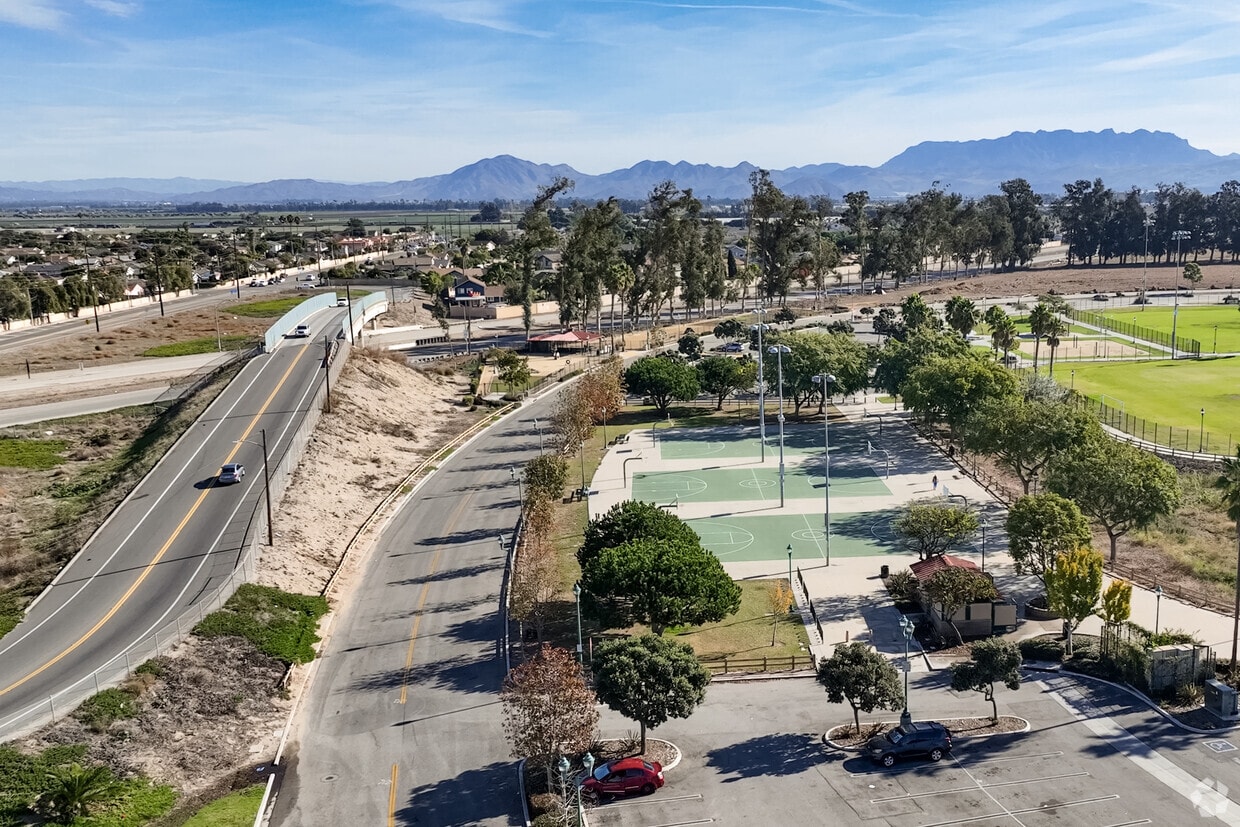
The beach is just a short drive away from College Park Oxnard.
The beach is just a short drive away from College Park Oxnard.
The beach is just a short drive away from College Park Oxnard.
The city of Oxnard offers affordable living at Sunny Acres Mobile Home Park in College Park.
As of March 2026, the average apartment rent in Oxnard, CA is $2,092 for a studio, $2,190 for one bedroom, $2,695 for two bedrooms, and $3,420 for three bedrooms. Apartment rent in Oxnard has decreased by -0.1% in the past year.
Explore how walkable, bikeable, drivable, and transit-friendly Oxnard, CA is for everyday living.
Somewhat Walkable
You might be able to get out and walk when living in this area. Some errands can be accomplished on foot, but for others you’ll need a car.
Some Transit
You'll likely want a car when living in this area since it has few transit options.
Bikeable
While there’s some bike infrastructure in this area, you’ll still need a car for many errands.
Public
Grades K-5

Public
Grades K-5

Public
Grades K-5
Public
Grades K-8

Rio Real Dual Immersion Academy
Public
Grades K-8
R.J. Frank Academy of Marine Science & Engineering
Public
Grades 6-8
Haydock Academy of Arts & Sciences
Public
Grades 6-8
Public
Grades K-8
Rio Real Dual Immersion Academy
Public
Grades K-8
Public
Grades K-8
Public
Grades 9-12
Public
Grades 9-12
Public
Grades 9-12
Public
Grades 9-12
1,913 Students

Public
Grades 9-12

90
Communities
27,655
Units
77
Cities

107
Communities
37,535
Units
58
Cities

3,487
Communities
959,069
Units
894
Cities

624
Communities
125,068
Units
245
Cities

554
Communities
124,135
Units
220
Cities

164
Communities
28,414
Units
83
Cities
† Our analysis of utilities, groceries, transportation, healthcare, home prices, and other goods and services is sourced from the Cost of Living Index, a respected benchmark published by the Council for Community and Economic Research (C2ER) that provides a thorough overview of living expenses across different regions.
Rent data is provided by CoStar Group’s Market Trend reports. As the industry leader in commercial real estate information, analytics, and news, CoStar conducts extensive research to produce and maintain a comprehensive database of commercial real estate information. We combine this data with public record to provide the most up-to-date rental information available.
Consumer goods, services, and home prices are sourced from the Cost of Living Index published by the Council for Community and Economic Research (C2ER). The data on this page is updated quarterly. It was last published in February 2026.


