
The Oslo KC
13500 Antioch Rd,
Overland Park, KS 66221
$1,465 - $4,554
Studio - 3 Beds

Living in Overland Park combines suburban comfort with city convenience in Kansas's second-most populous city. Located in the Kansas City metropolitan area, Overland Park features an extensive park system spanning over 1,800 acres. The Overland Park Arboretum and Botanical Gardens offers 300 acres of natural space, while miles of hiking and biking trails, playgrounds, and sports facilities support active residents. Johnson County Community College and the University of Kansas Edwards Campus provide higher education opportunities, while Oak Park Mall and Downtown Overland Park's year-round Farmers' Market serve as community gathering spots. The rental market shows moderate growth, with average rent for a one-bedroom apartment at $1,326, showing a 6.4% increase year-over-year, while two-bedroom units average $1,650.
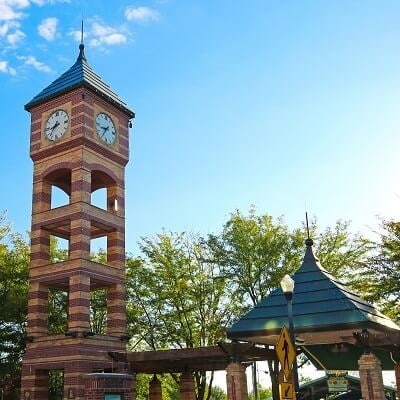
Overland Park offers varied housing options across its neighborhoods, from apartments near the Corporate Woods business district to residential communities in the downtown area. Community amenities include the Scheels Overland Park Soccer Complex and the Deanna Rose Children's Farmstead. The Nerman Museum of Contemporary Art and Johnson County Arts and Heritage Center provide cultural experiences throughout the year. Located near Interstates 435 and 35, the city offers convenient commuting options. Recent additions like Prairiefire have brought entertainment venues to complement the established neighborhoods. The median household income is $94,966, reflecting the area's economic stability.
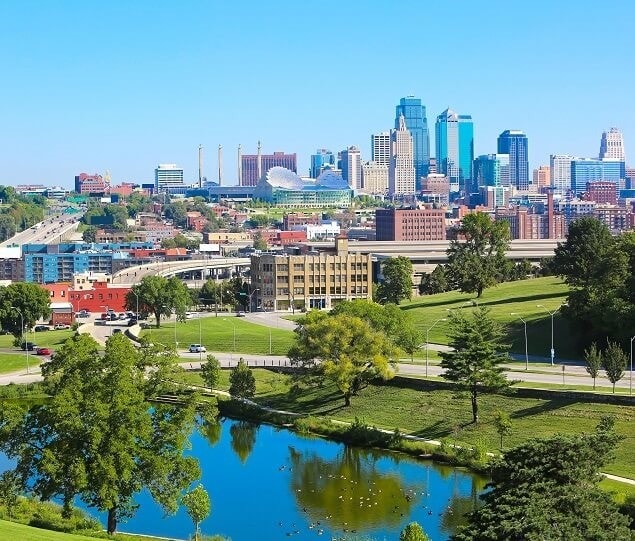
The Kansas City skyline from Overland
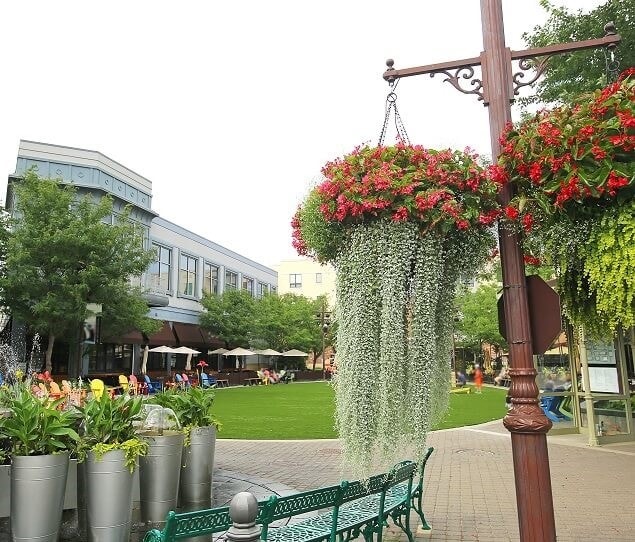
The popular shopping destination Park Place is located in neighboring Leawood
As of March 2026, the average apartment rent in Overland Park, KS is $1,274 for a studio, $1,320 for one bedroom, $1,664 for two bedrooms, and $2,050 for three bedrooms. Apartment rent in Overland Park has decreased by -1.0% in the past year.
Explore how walkable, bikeable, drivable, and transit-friendly Overland Park, KS is for everyday living.
Somewhat Walkable
You might be able to get out and walk when living in this area. Some errands can be accomplished on foot, but for others you’ll need a car.
Minimal Transit
You'll likely want a car when living in this area since it has few transit options.
Bikeable
While there’s some bike infrastructure in this area, you’ll still need a car for many errands.
Timber Creek Elementary School
Public
Grades K-5

Public
Grades K-5

Public
Grades K-5
Public
Grades K-5
Public
Grades K-5
Public
Grades 6-8
Public
Grades 6-8
Public
Grades 6-8
Public
Grades 6-8
Public
Grades 6-8

Public
Grades 9-12

Public
Grades 9-12
1,414 Students
Blue Valley Southwest High School
Public
Grades 9-12
Public
Grades 9-12
21
Communities
4,946
Units
12
Cities

16
Communities
2,976
Units
8
Cities

3,490
Communities
959,772
Units
895
Cities

17
Communities
5,593
Units
10
Cities

292
Communities
85,901
Units
169
Cities

12
Communities
780
Units
7
Cities
† Our analysis of utilities, groceries, transportation, healthcare, home prices, and other goods and services is sourced from the Cost of Living Index, a respected benchmark published by the Council for Community and Economic Research (C2ER) that provides a thorough overview of living expenses across different regions.
Rent data is provided by CoStar Group’s Market Trend reports. As the industry leader in commercial real estate information, analytics, and news, CoStar conducts extensive research to produce and maintain a comprehensive database of commercial real estate information. We combine this data with public record to provide the most up-to-date rental information available.
Consumer goods, services, and home prices are sourced from the Cost of Living Index published by the Council for Community and Economic Research (C2ER). The data on this page is updated quarterly. It was last published in February 2026.


