
Baxter on Broadway
4901 Broadway,
Oakland, CA 94611
$2,295 - $4,676 Total Monthly Price
Studio - 3 Beds


Oakland combines city living with natural beauty across its diverse neighborhoods. The downtown area showcases restored Art Deco architecture alongside a flourishing arts scene, while Lake Merritt, the nation's first wildlife refuge, offers paths for jogging, spots for picnicking, and opportunities for wildlife watching. From the Victorian homes in Adams Point to apartments in Uptown, residents live near landmarks like the historic Fox Theater. The Oakland Hills provide sweeping Bay views and access to Redwood Regional Park's majestic forest trails. The Jack London Square district features waterfront restaurants and entertainment, while the Mills College campus adds to the city's educational landscape.
Oakland's rental market remains competitive, with one-bedroom apartments averaging $2,076 and two-bedroom units at $2,675, showing year-over-year increases of 0.3% and 0.9% respectively. Housing options include downtown high-rises and classic craftsman homes in neighborhoods like Rockridge and Temescal. The Lake Merritt area puts residents steps from weekend farmers' markets and lakeside activities, while Uptown features art galleries and entertainment venues. According to current data from Apartments.com, Oakland's population density of 1,843 people per square mile and median household income of $114,922 reflects the city's metropolitan character.
Downtown Oakland from Lake Merritt
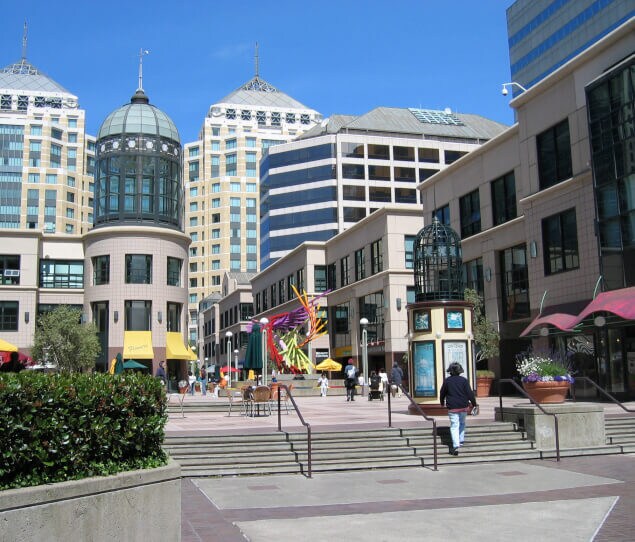
Oakland City Center contains shops, hotels, and other businesses
Evening view of Oakland
As of March 2026, the average apartment rent in Oakland, CA is $1,703 for a studio, $2,109 for one bedroom, $2,710 for two bedrooms, and $3,289 for three bedrooms. Apartment rent in Oakland has increased by 1.6% in the past year.
The cost of living in Oakland, CA is 32.5% higher than the national average. Generally, housing in Oakland is 56.7% more expensive than the national average, with rent falling between $1,703 - $3,289. You can expect to pay 12.0% more for groceries, 46.7% more for utilities, and 37.4% more for transportation.
Explore how walkable, bikeable, drivable, and transit-friendly Oakland, CA is for everyday living.
Very Walkable
If you enjoy walking, you’ll enjoy renting in this area! It’s a very walkable neighborhood.
Good Transit
The area around this property has good transit with many nearby transportation options.
Very Bikeable
This area is very bikeable. You’ll find a variety of bike paths and lanes.
Public
Grades K-5

Public
Grades K-5
Public
Grades K-5
268 Students
Public
Grades K-5

Public
Grades K-8
Public
Grades 6-8
Public
Grades 6-8
Public
Grades K-8
Public
Grades K-8
Francophone Charter School Of Oakland
Public
Grades K-8
Conservatory Of Vocal/Instrumental Arts High
Public
Grades 9-12
Public
Grades 9-12
Public
Grades 9-12
Public
Grades 9-12

Public
Grades 9-12

19
Communities
482
Units
1
City

3,495
Communities
959,706
Units
893
Cities

14
Communities
852
Units
2
Cities

11
Communities
1,018
Units
4
Cities

457
Communities
108,184
Units
229
Cities

64
Communities
19,029
Units
25
Cities
† Our analysis of utilities, groceries, transportation, healthcare, home prices, and other goods and services is sourced from the Cost of Living Index, a respected benchmark published by the Council for Community and Economic Research (C2ER) that provides a thorough overview of living expenses across different regions.
Rent data is provided by CoStar Group’s Market Trend reports. As the industry leader in commercial real estate information, analytics, and news, CoStar conducts extensive research to produce and maintain a comprehensive database of commercial real estate information. We combine this data with public record to provide the most up-to-date rental information available.
Consumer goods, services, and home prices are sourced from the Cost of Living Index published by the Council for Community and Economic Research (C2ER). The data on this page is updated quarterly. It was last published in February 2026.


