Median Age
42 Years
Largest Age Group
55-64 Years
Approximately 15% of Residents
Under 20
22%
Over 65
18%

Avg Rent
$1,204
Population
5,575
Renter Mix
26% Rent
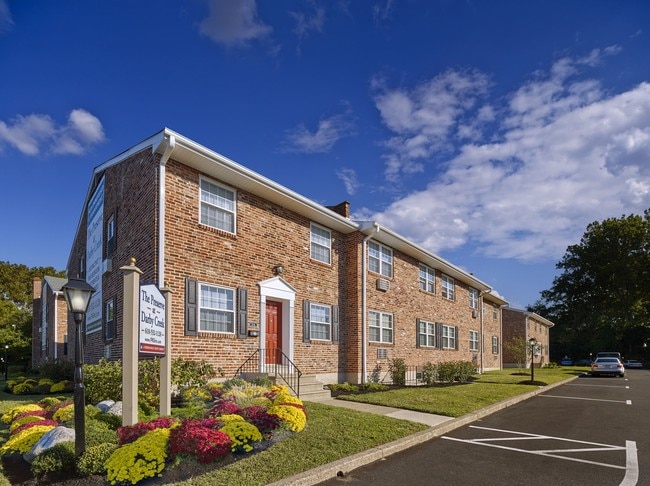
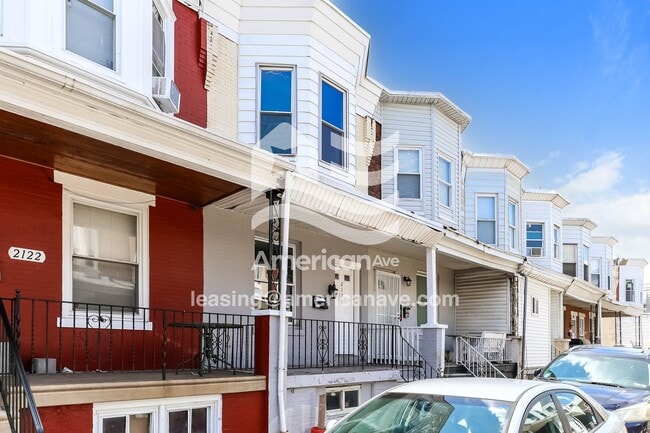
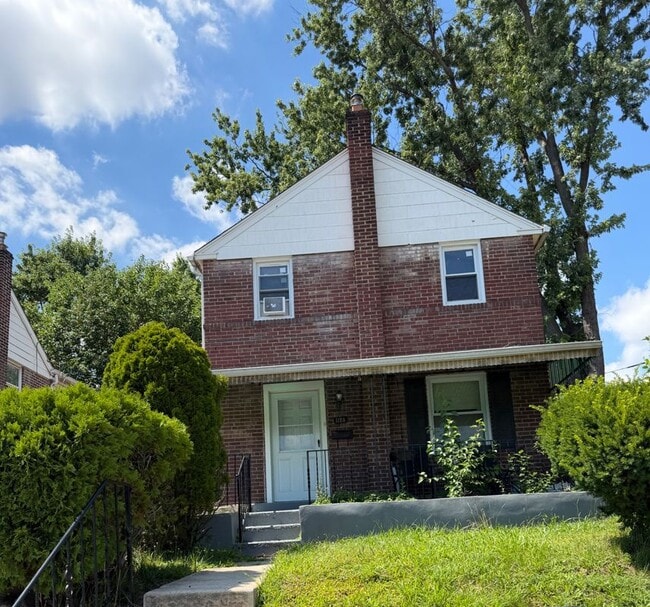
A close-knit Philadelphia suburb in Delaware County, Norwood keeps daily life at a relaxed, residential pace while the city sits just about 15 miles to the northeast. The borough covers roughly one square mile along Darby Creek, with tree-lined streets of well-maintained Colonial Revivals, ranch-style homes, and Cape Cods that give the community a settled, unhurried character. Chester Pike serves as the main commercial artery, and the MacDade Mall area directly north adds convenient retail and dining options without requiring a long drive.
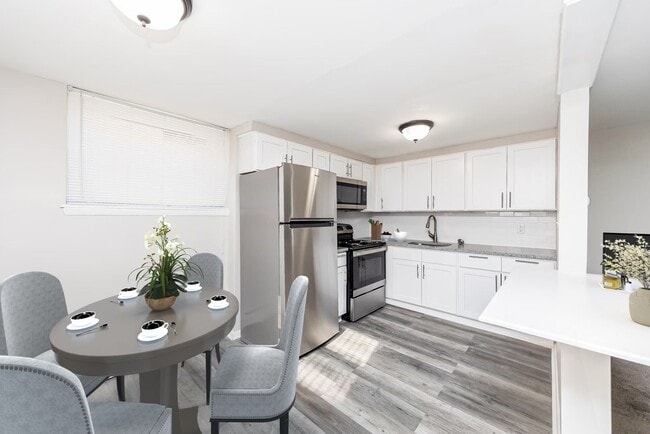
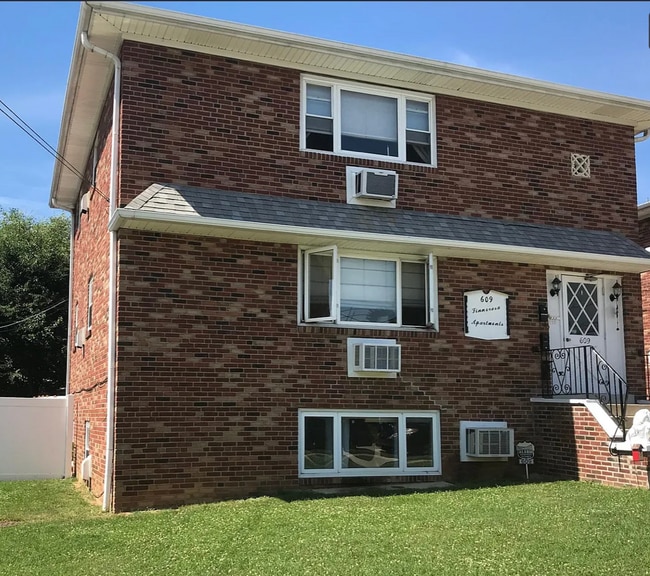
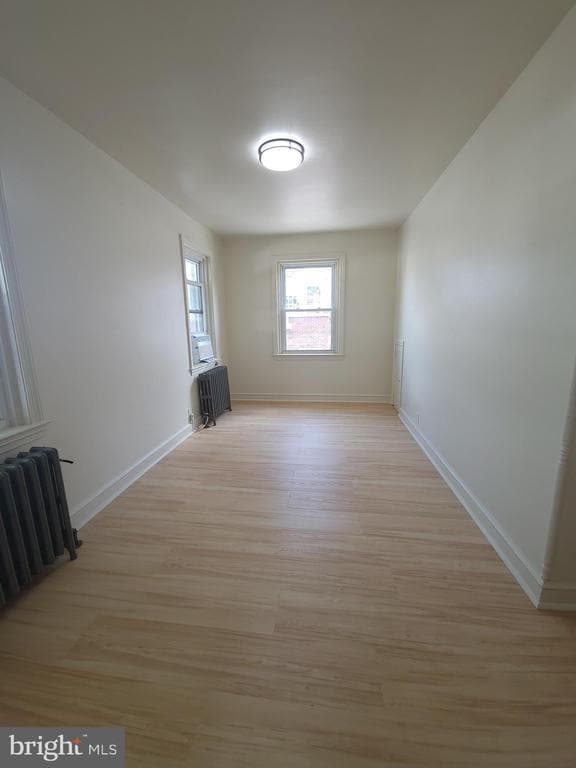
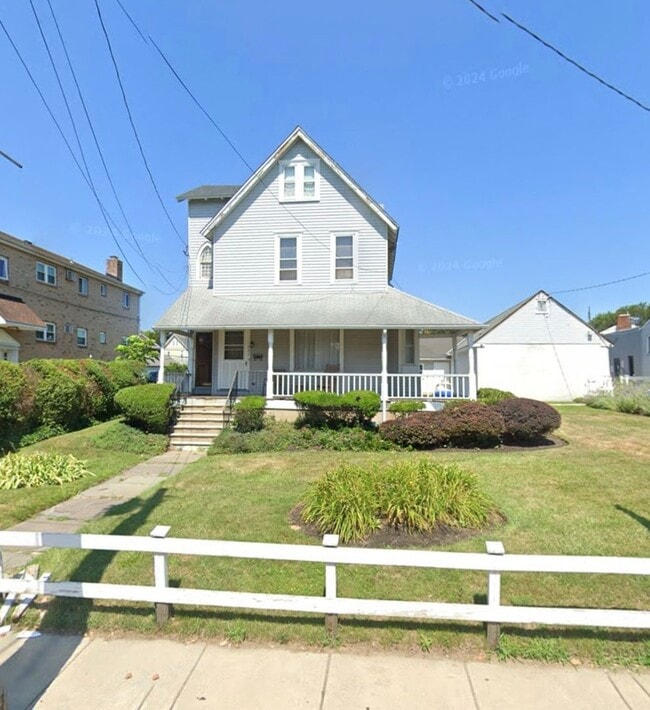
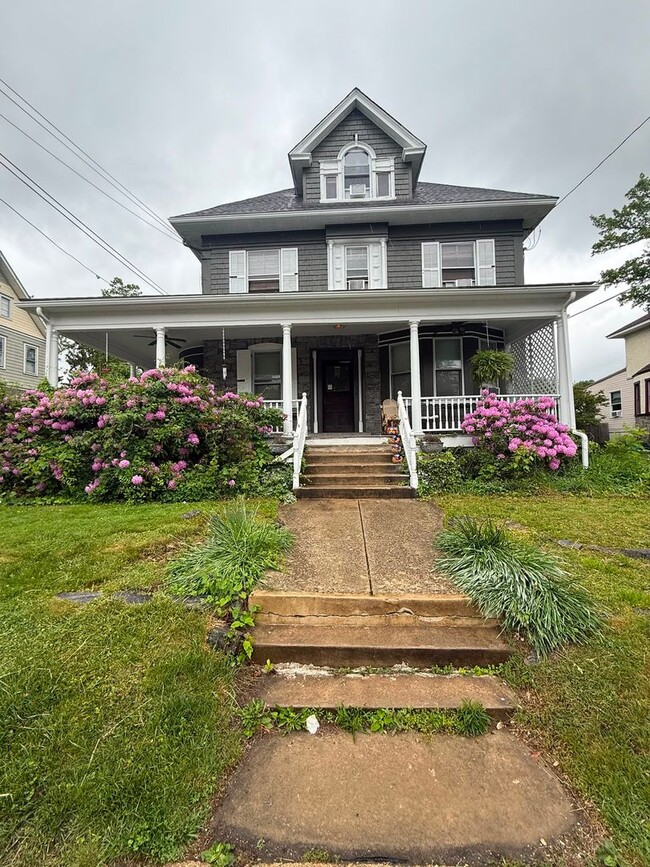
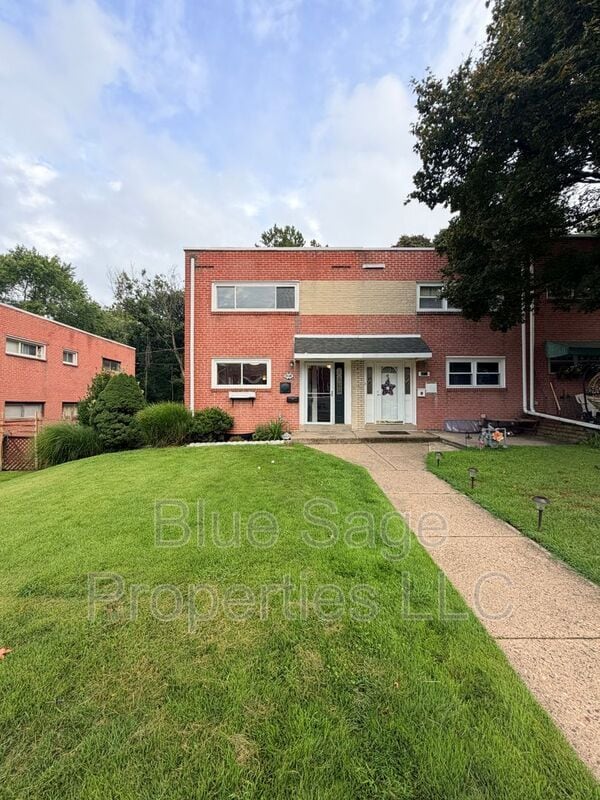
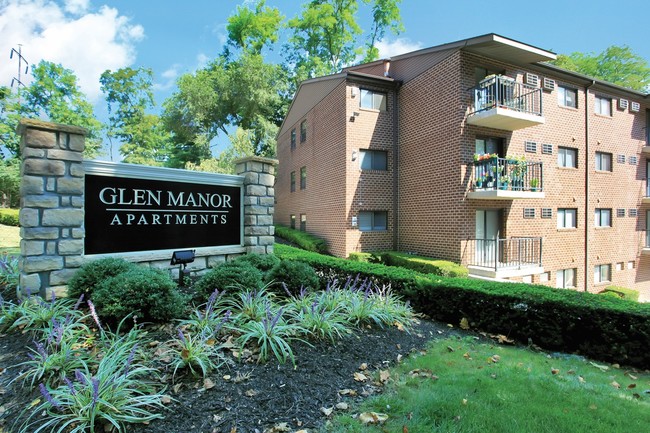
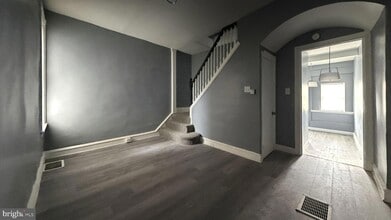
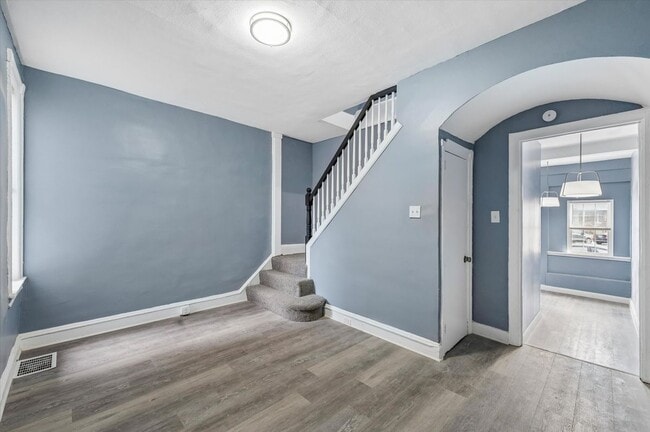
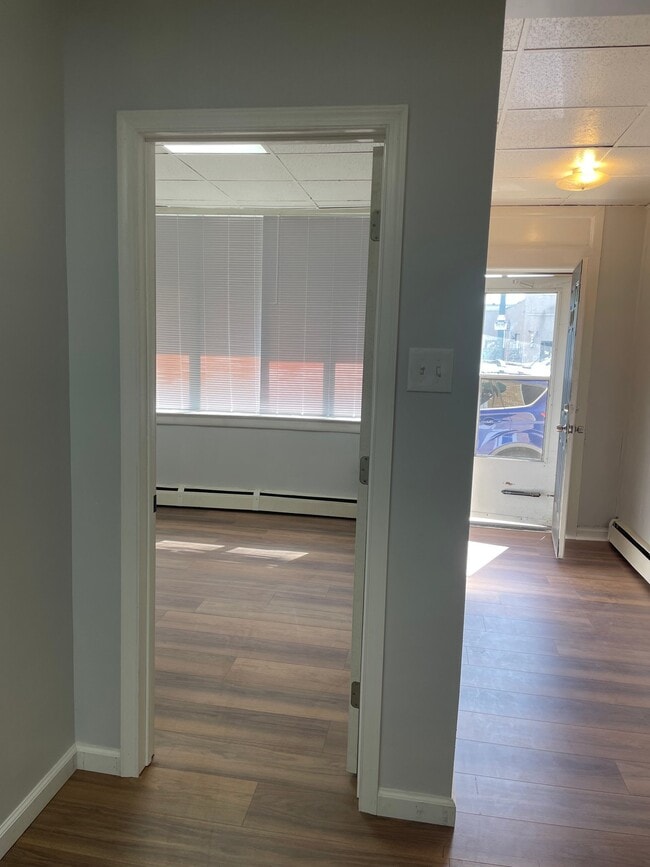
Renters in Norwood will find a modest but accessible inventory of apartments and townhomes, with most rental units occupying smaller-scale buildings that match the borough's low-rise residential fabric. The borough sits directly across from Philadelphia International Airport, separated by Darby Creek and the John Heinz National Wildlife Refuge, giving Norwood an unexpectedly scenic eastern edge.
Median Household Income
$92,587
Average: $96,311
Education
1,339
Residents Have a Degree
Job Market
3,059
Workers Employed
Median Age
42 Years
Largest Age Group
55-64 Years
Approximately 15% of Residents
Under 20
22%
Over 65
18%
Housing Distribution
Norwood has more homeowners than renters.

Education Distribution
Review this city's overall education levels.

As of August 2026, the average apartment rent in Norwood, PA is $1,028 for a studio, $1,204 for one bedroom, and $1,428 for two bedrooms. Apartment rent in Norwood has increased by 2.5% in the past year.
Explore how walkable, bikeable, drivable, and transit-friendly Norwood, PA is for everyday living.
Moderately Walkable
Walkability
Some Public Transit
Transit
Exceptionally Drivable
Drivability
Fairly Bikeable
Bikeability

Public
Grades K-8
557 Students

Public
Grades K-8
557 Students
 The GreatSchools Rating helps parents compare schools within a state based on a variety of school quality indicators and provides a helpful picture of how effectively each school serves all of its students. Ratings are on a scale of 1 (below average) to 10 (above average) and can include test scores, college readiness, academic progress, advanced courses, equity, discipline and attendance data. We also advise parents to visit schools, consider other information on school performance and programs, and consider family needs as part of the school selection process.
View GreatSchools Rating Methodology
Data provided by
GreatSchools.org
© 2026. All rights reserved.
The GreatSchools Rating helps parents compare schools within a state based on a variety of school quality indicators and provides a helpful picture of how effectively each school serves all of its students. Ratings are on a scale of 1 (below average) to 10 (above average) and can include test scores, college readiness, academic progress, advanced courses, equity, discipline and attendance data. We also advise parents to visit schools, consider other information on school performance and programs, and consider family needs as part of the school selection process.
View GreatSchools Rating Methodology
Data provided by
GreatSchools.org
© 2026. All rights reserved.
† Our analysis of utilities, groceries, transportation, healthcare, home prices, and other goods and services is sourced from the Cost of Living Index, a respected benchmark published by the Council for Community and Economic Research (C2ER) that provides a thorough overview of living expenses across different regions.
Rent data is provided by CoStar Group’s Market Trend reports. As the industry leader in commercial real estate information, analytics, and news, CoStar conducts extensive research to produce and maintain a comprehensive database of commercial real estate information. We combine this data with public record to provide the most up-to-date rental information available.
Consumer goods, services, and home prices are sourced from the Cost of Living Index published by the Council for Community and Economic Research (C2ER). The data on this page is updated quarterly. It was last published in June 2026.
Demographic information comes from Neustar and combines detailed address data with U.S. Census and American Community Survey statistics to produce reliable local estimates.