Median Age
40 Years
Largest Age Group
35-44 Years
Approximately 16% of Residents
Under 20
23%
Over 65
17%
Area Guide
Avg Rent
$1,179
Population
6,164
Renter Mix
38% Rent
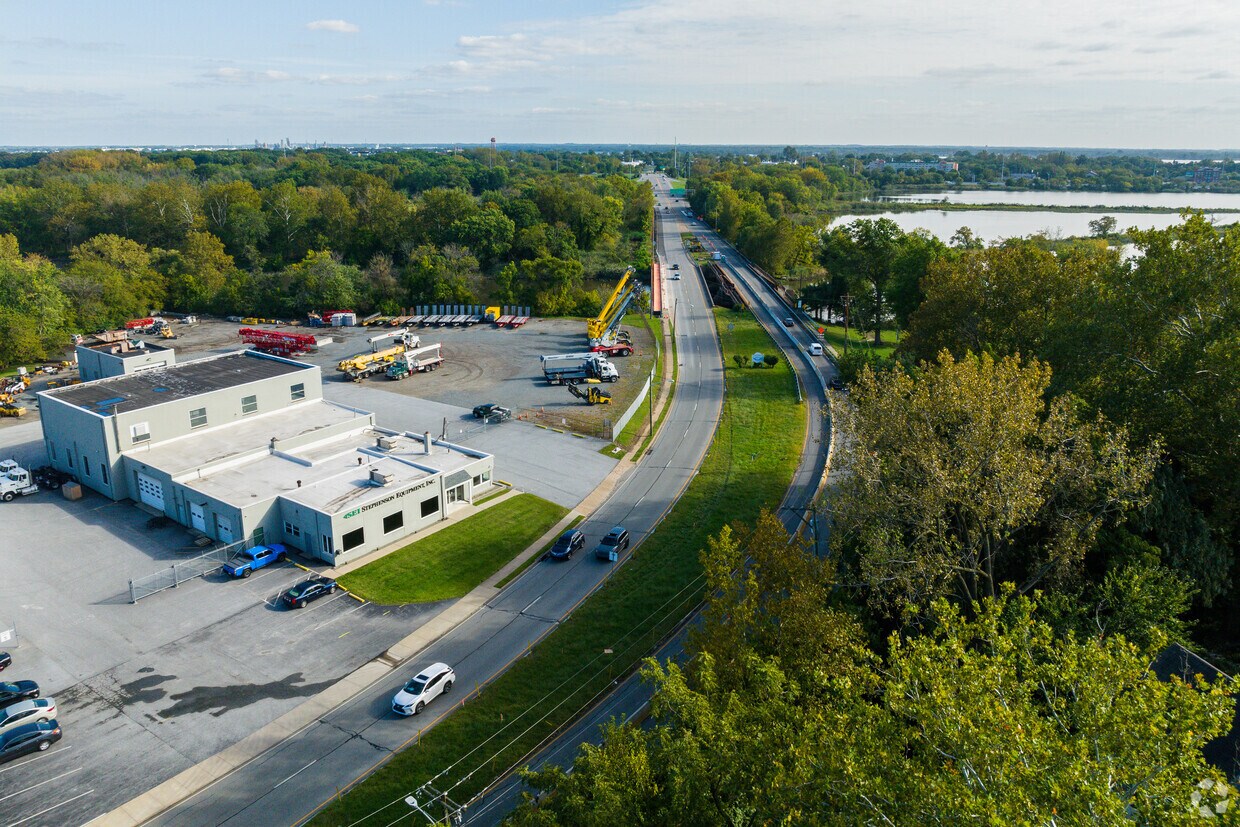
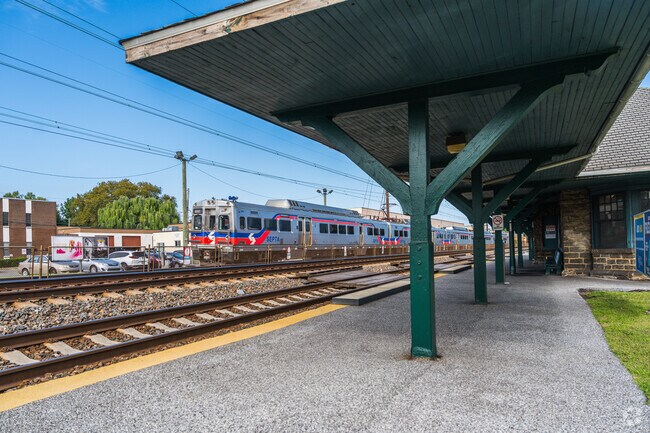
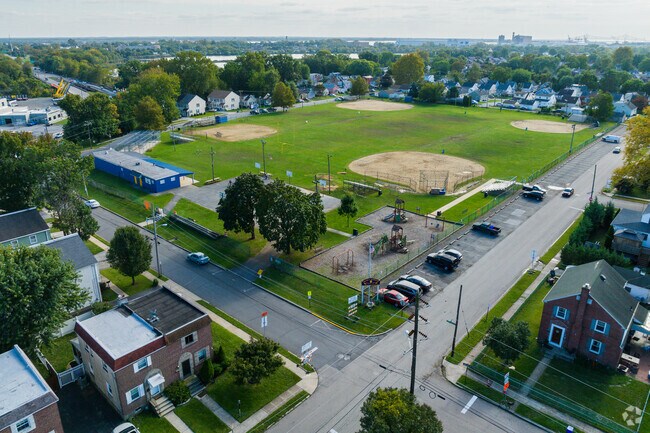
Prospect Park is a small borough tucked into Delaware County, about twelve miles southwest of downtown Philadelphia, where the pace slows down without losing easy access to a major city. Originally developed in the 1870s as a residential retreat from the city, this one-square-mile community has held onto that identity ever since. SEPTA rail service connects residents directly to Center City Philadelphia, making it a practical base for those who work or study in the metro area. Nearby institutions like Neumann University and Widener University add educational weight to the broader Delaware County corridor.
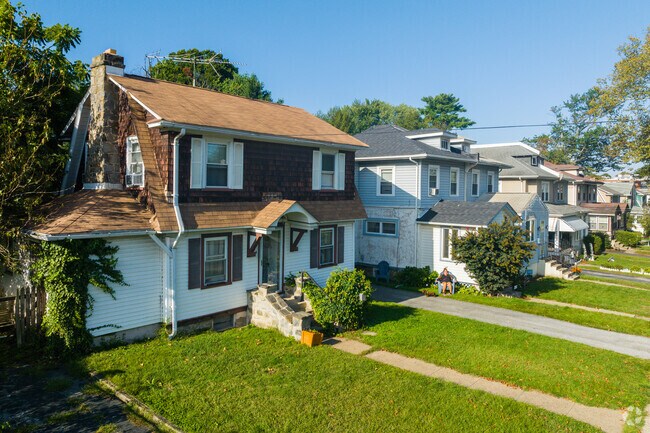
The borough has a tight-knit residential character, with tree-lined streets and modest commercial activity concentrated along Lincoln Avenue. Housing options range from single-family homes converted into rental units to straightforward apartment communities suited for a range of renters. Studios and one- and two-bedroom units make up the bulk of available rentals, with traditional low-rise buildings setting the architectural tone throughout the area.
A commuter's dream for access to two major cities in Prospect Park, PA.
A place for community gatherings in Prospect Park, PA.
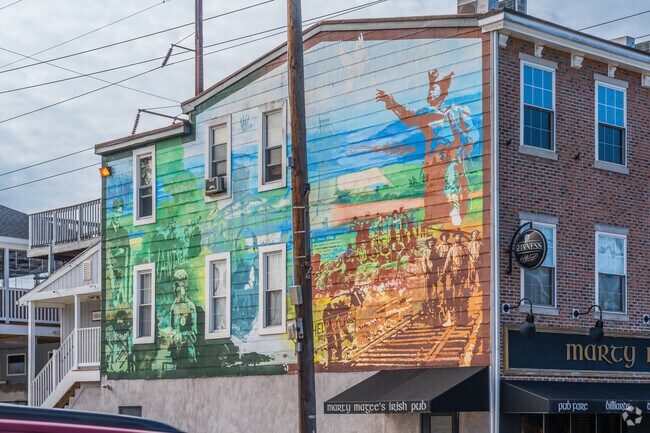
Artist murals at its finest in Prospect Park, PA
Shops line a street in Prospect Park
A Resident taking a walk with her pets in Prospect Park, PA
Biking through the town center of Prospect Park, PA
Median Household Income
$66,830
Average: $91,789
Education
1,530
Residents Have a Degree
Job Market
3,807
Workers Employed
Median Age
40 Years
Largest Age Group
35-44 Years
Approximately 16% of Residents
Under 20
23%
Over 65
17%
Housing Distribution
Prospect Park has more homeowners than renters.

Education Distribution
Review this city's overall education levels.

As of June 2026, the average apartment rent in Prospect Park, PA is $1,089 for a studio, $1,179 for one bedroom, and $1,549 for two bedrooms. Apartment rent in Prospect Park has increased by 2.2% in the past year.
Explore how walkable, bikeable, drivable, and transit-friendly Prospect Park, PA is for everyday living.
Fairly Walkable
Walkability
Some Public Transit
Transit
Moderately Drivable
Drivability
Somewhat Bikeable
Bikeability
Public
Grades K-8
552 Students

Public
Grades K-5
239 Students

Public
Grades K-8
552 Students
Public
Grades 9-12
1,028 Students

† Our analysis of utilities, groceries, transportation, healthcare, home prices, and other goods and services is sourced from the Cost of Living Index, a respected benchmark published by the Council for Community and Economic Research (C2ER) that provides a thorough overview of living expenses across different regions.
Rent data is provided by CoStar Group’s Market Trend reports. As the industry leader in commercial real estate information, analytics, and news, CoStar conducts extensive research to produce and maintain a comprehensive database of commercial real estate information. We combine this data with public record to provide the most up-to-date rental information available.
Consumer goods, services, and home prices are sourced from the Cost of Living Index published by the Council for Community and Economic Research (C2ER). The data on this page is updated quarterly. It was last published in June 2026.
Demographic information comes from Neustar and combines detailed address data with U.S. Census and American Community Survey statistics to produce reliable local estimates.


